Figures & data
Figure 1. Locations of transplant plots in Lake Susan. Each plot contained 5 sites with 1 species planted at each site.
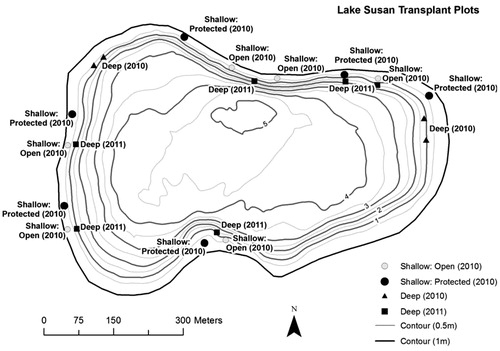
Table 1. Summary of mean (±1 SE) sediment bulk density, mean percent organic matter, and mean total nitrogen in soil samples taken July 2011.
Figure 2. Example of plant growth assessment with area of presence and homogenous area of growth indicated. This site was planted with wild celery (Vallisneria americana).
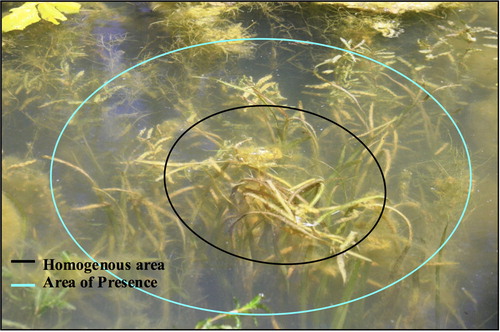
Figure 3. Survival of plant taxa in shallow plots by year (top) and overall survival by protection treatment (bottom).
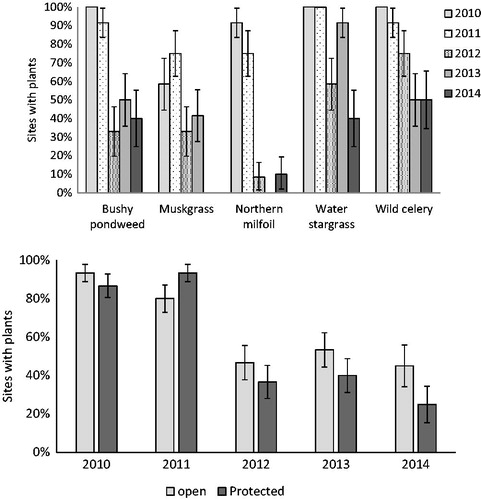
Figure 4. Mean homogenous area of growth at open (hollow) and protected (stippled) sites by year of transplant in shallow plots. Initial planted area (indicated by dashed line) was 0.25 m2. Note area axis is in logarithmic scale of base 10. Error bars are ±1 SE.
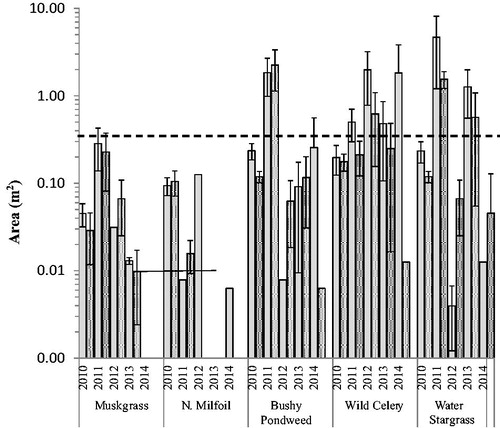
Figure 5. The mean area of presence of plants at open (hollow) and protected (stippled) sites by year of transplant in shallow plots. Initial area planted (indicated by dashed line) was 0.25 m2. Note area axis is in logarithmic scale of base 10. Error bars are ±1 SE.
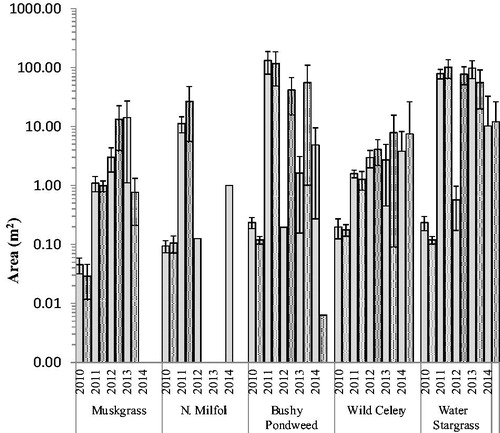
Figure 6. Comparison of mean survival and area of presence for taxa in shallow plots during the 2011 growing season.
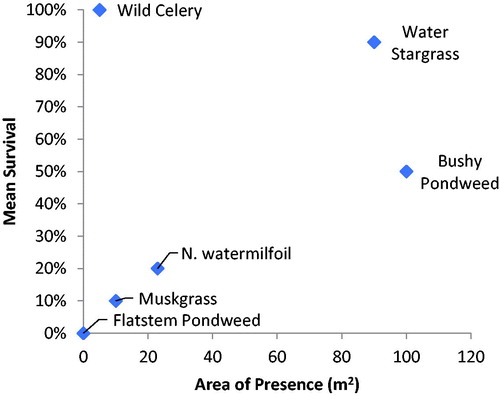
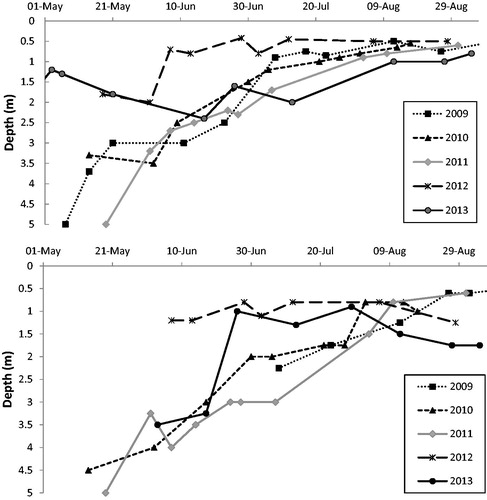
Figure 7. Lake Susan Secchi depth by year (top), and depth of 5% PAR by year (bottom).