
Figures & data
Figure 1. Location of Lake Kleine Melanen in The Netherlands (left) and detailed map of the lake (right). 1 = sampling location 1993–2008, 2 = sampling location 2009–2014, 3 = location of outlet weir, 4 = locations of the enclosure experiment.
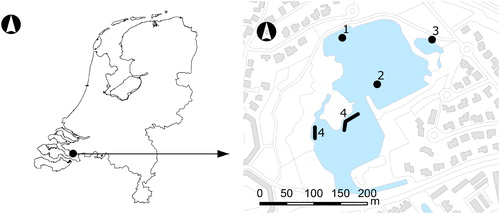
Table 1. Characteristics of Lake Kleine Melanen before restoration (situation in 2009; TP and Chl-a are the mean concentrations for the period 2008–2009, samples taken at water depth 30 cm).
Table 2. Restoration measures, date of implementation and details. LMB = lanthanum modified bentonite.
Table 3. External P loads (mg P/m2/d) of Lake Kleine Melanen before restoration (see Supplement for details).
Table 4. Sediment characteristics (density, % dry matter, % organic matter) and concentrations of total phosphorus (TP), iron (Fe), and sulfur (S) in sediment (A; g/kg DW) and pore water (B; mg/L). DW = dry weight, SE in parentheses (data extracted from Waltjé et al. Citation2009).
Figure 2. Total phosphorus (TP) concentrations (mg/L) in enclosure experiment. Treatments: C (control, panel A), S (sand capping, panel B), SL (sand capping + LMB, panel C), SLP (sand capping + LMB + PAC, panel D). The gray areas indicate the TP concentration in the lake (days −11 to 87). Open symbols indicate the TP concentration on day −4, at 1.5 h after sand addition. Error bars indicate 1 SE (n = 3). In panel B the course of TP in each replicate is presented.
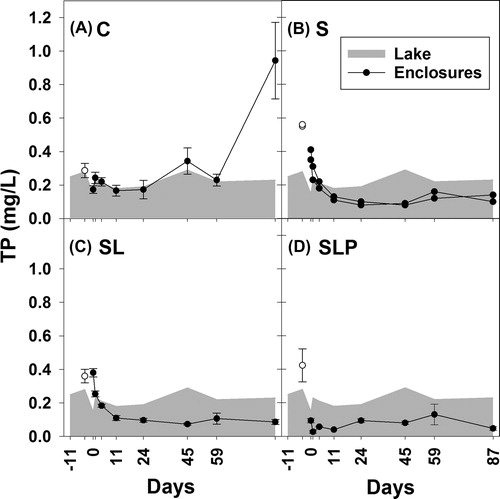
Figure 3. Ortho-phosphate (OP) concentrations (mg/L) in enclosure experiment. Treatments: C (control, panel A), S (sand capping, panel B), SL (sand capping + LMB, panel C), SLP (sand capping + LMB + PAC, panel D). The gray areas indicate the OP concentration in the lake (days −11 to 87). Open symbols indicate the OP concentration on day −4, at 1.5 h after sand addition. Error bars indicate 1 SE (n = 3). In panel B the course of OP in each replicate is presented.
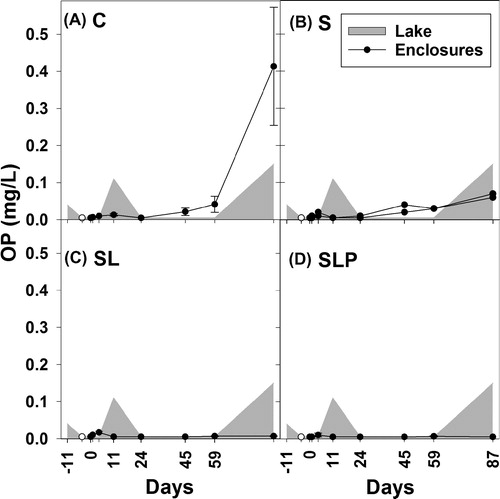
Table 5. Enclosure experiment: median concentrations of total phosphorus (TP, mg/L), ortho-phosphate (OP, mg/L), total nitrogen (TN, mg/L), total and cyanobacterial Chl-a (µg/L), total and filterable lanthanum (TLa, FLa, µg/L) and median turbidity (FTU, Formazin Turbidity Units) in control (C; n = 3) enclosures and in enclosures with sand capping (S; n = 2), sand capping + LMB (SL; n = 3), and sand capping + LMB + PAC (SLP; n = 3) during the 87 d experimental period. SE in parentheses except for OP. For OP, the number of sampling events with a mean concentration <0.01 mg P/L is given in parentheses (total number of sampling events = 8). The right column shows the results of nonparametric Kruskal–Wallis Test. Capital letters (A, B, C) indicate significantly different groups (P < 0.05).
Figure 4. Concentrations of total Chl-a (µg/L, open symbols) and cyanobacterial Chl-a (µg/L, filled symbols) in enclosure experiment. Treatments: C (control, panel A), S (sand capping, panel B), SL (sand capping + LMB, panel C), SLP (sand capping + LMB + PAC, panel D). The gray areas indicate the total Chl-a concentration and the hatched areas indicate the cyanobacterial Chl-a concentration in the lake (days −11 to 87). Symbols at day −4 indicate the Chl-a concentrations 1.5 h after sand addition. Error bars indicate 1 SE (n = 3). In panel B the course of total and cyanobacterial Chl-a in each replicate is presented.
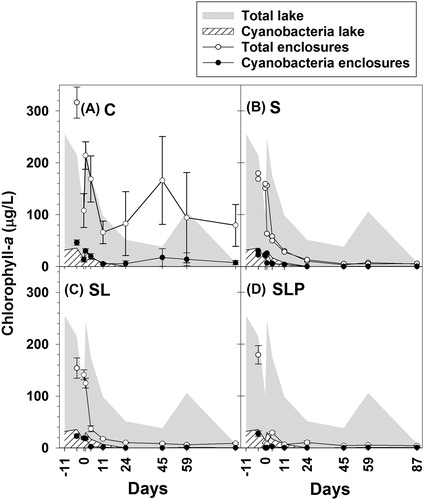
Table 6. Whole-lake measures: mean concentrations of total phosphorus (TP, mg/L), ortho-phosphate (OP, mg/L), total nitrogen (TN, mg/L), chlorophyll a (Chl-a, µg/L), cyanobacterial chlorophyll a (cyano Chl-a, µg/L), total and filterable lanthanum (TLa, FLa, µg/L), oxygen (O2, mg/L), and mean Secchi disk transparency (SDT, m) in Lake Kleine Melanen before (Jan 2008–Aug 2010), during (Sep 2010–Oct 2012), and after (Nov 2012–Oct 2014) measures were implemented, based on monthly sampling except cyano Chl-a, TLa, and FLa. SE in parentheses.