
Figures & data
Figure 1. Locations of study lakes.
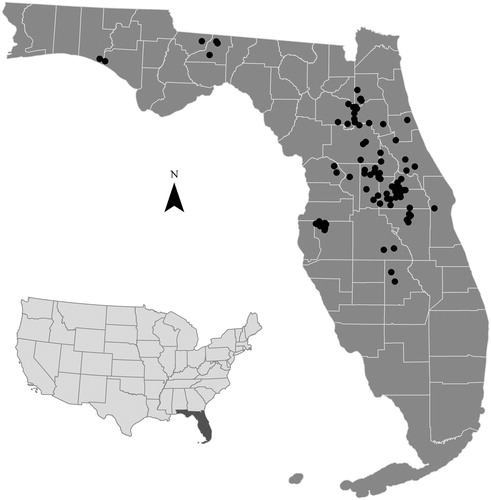
Table 1. Summary statistics for land use and nutrient data for 87 Florida lakes by total phosphorus zones (TP Zones; Bachmann et al. Citation2012). The number of lakes in each TP Zone is listed in parentheses. The mean values are recorded with the minimum and maximum values listed in parentheses. Means (2010) with an asterisk are significantly different from means measured in 1990.
Table 2. Output from stepwise multivariate linear regression models with total phosphorus and total nitrogen as the dependent variables and total phosphorus zone (Zone TP2, Zone TP3, or Zone TP4; Bachmann et al. Citation2012), time periods (1990 or 2010), and percent of the watershed in agriculture, urban, forest, and wetland land uses as the independent variables. Nutrient concentration data were log-transformed, and percent data were arcsine-transformed.
Figure 2. Frequency distribution of lakes with positive, negative, and no change in nutrient concentrations (total phosphorus and total nitrogen) over time listed within TP Zones (Bachmann et al. Citation2012) where the lakes reside.
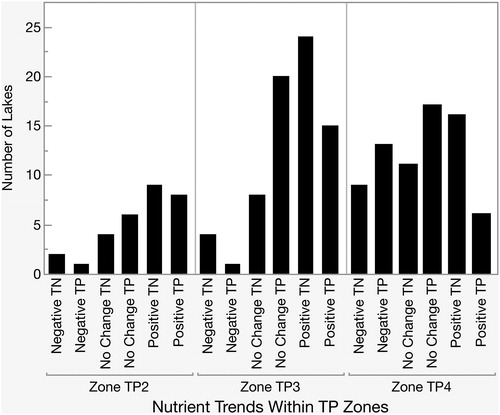
Table 3. Output from multivariate ordinal logistic regression models with total phosphorus and total nitrogen trend group (1 increase, 0 no change, −1 decrease) as the dependent variables and TP Zone, percent change from 1990 to 2010 within the watershed in agriculture, urban, forest, and wetland land use as the independent variables. Nutrient concentration data were log-transformed, and percent change data were normally distributed requiring no transformation.
Figure 3. Frequency distribution of lakes with positive, negative, and no relation between nutrient concentrations (total phosphorus and total nitrogen) and adjusted cumulative rainfall deviations (ACRD) over time listed within TP Zones (Bachmann et al. Citation2012) where the lakes reside.
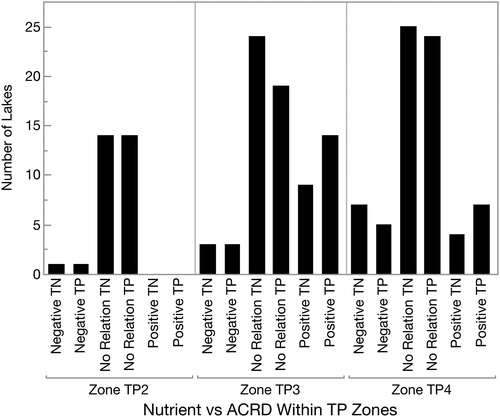
Table 4. Output from multivariate ordinal logistic regression model with the relationship between total phosphorus and total nitrogen with rainfall group (ACRD: 1 increase, 0 no change, −1 decrease) as the dependent variables and TP Zone, percent change from 1990 to 2010 within the watershed in agriculture, urban, forest, and wetland land use as the independent variables. Nutrient concentration data were log-transformed, and percent data and percent change data were normally distributed requiring no transformation.