Figures & data
Figure 1. (A) Location of Como Lake in Saint Paul, MN. (B) The 721 ha watershed includes a regional park and single-family residential neighborhoods. (C) Impervious surface cover varies across the watershed.
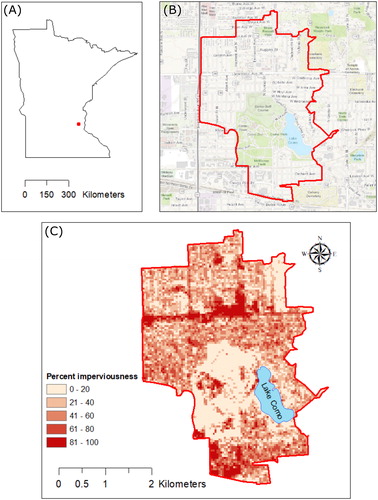
Figure 2. Comparison of model (Baseline Scenario) and observed values for lake level (A) and water-column total P (B). Circles are observed values. The horizontal dashed line represents the ordinary high-water level. The vertical dashed line represents the date of stormwater BMP implementation in our simulation.
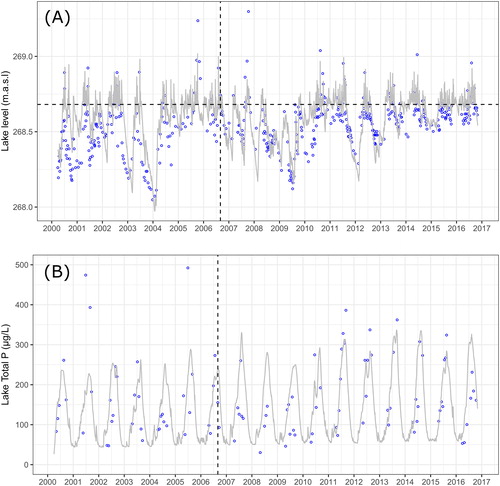
Table 1. Parameter values used in this model. Pi and PS values were calibrated for this model; all other values are from Jensen et al. (Citation2006).
Figure 3. (A) Lake water column total P in the baseline scenario and in Sensitivity Analyses 1–3. The dashed line represents the date of stormwater BMP implementation in our simulations. The shaded area (2015–2016) is expanded in (B) to better depict representative differences between scenarios.
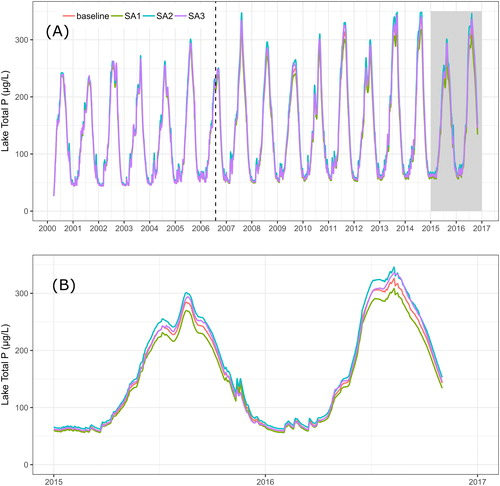
Table 2. Sensitivity analyses testing effects of central assumptions of model. Model simulation period 2000–2016.
Table 3. Summary of model scenarios. Mean concentrations and cumulative fluxes are calculated for the 10 yr period following BMP implementation.
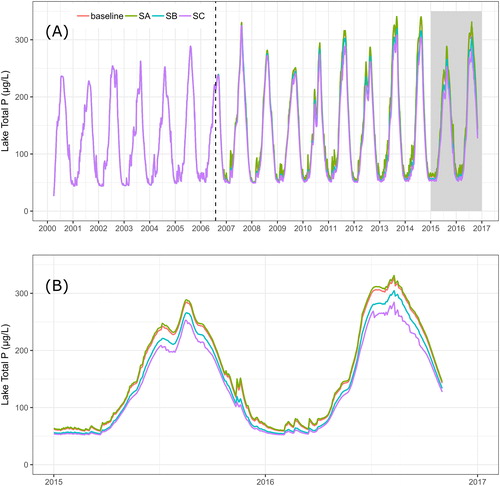
Figure 4. Lake water column total P in the baseline scenario and in Scenarios A, B, and C. The dashed line represents the date of stormwater BMP implementation in our simulations. The shaded area (2015–2016) is expanded in (B) to better depict representative differences between scenarios.