
Figures & data
Figure 1. Lakes and reservoirs included in analysis as CB-affected systems. The reported number represents the total number of years each system appeared on a state CB advisory list through the year 2014.
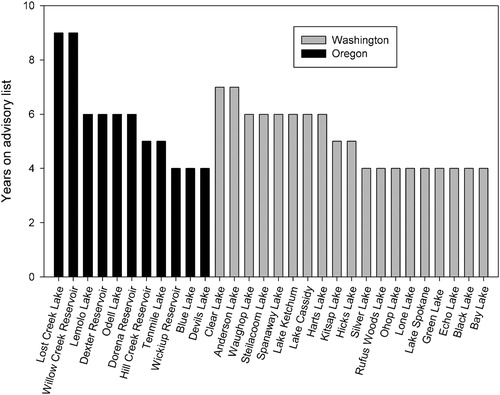
Figure 2. Locations of CB-affected, NLA unaffected, and all other lakes and reservoirs included on Washington (2007–2014) and Oregon (2005–2014) state advisory lists.
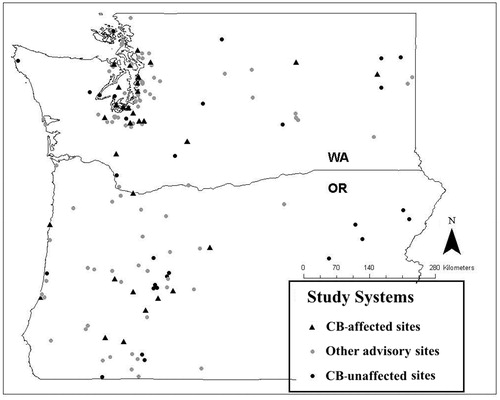
Table 1. CB-affected and unaffected lakes and reservoirs used in regression analysis, listed with state, CB advisory status, and water quality data sources.
Table 2. Significance results (P values) for all variables tested in multiple logistic regression analysis and performance results for all models tested (AIC and R2 values) and used in development of a final multi-category model. An “X” indicates a variable that was included in an initial model but was removed during AIC optimization.
Table 3. Results of pairwise Pearson’s correlation analysis of water quality, lake morphometry, and land use data used in logistic regression analysis. Correlation values are shown only for those variables with a strong correlation (≥0.5).
Table 4. Univariate logistic regression results for all water quality, lake morphometry, and land use variables.
Figure 3. Systems predicted to be at high risk of developing future CBs based on a preliminary screening of NLA systems using the Chl-a–based univariate model for a probability of >0.5. Line used to label Mann Lake due to overlapping data points for systems with similar values.
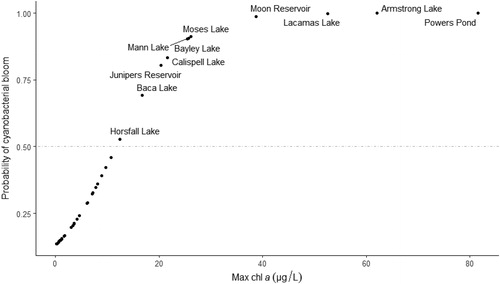
Table 5. Parameter results for the 2 final multiple logistic regression models predicting CB occurrence developed from water quality, lake morphometry, and land use factors.
Table 6. Confidence interval estimates for variables included in multiple logistic regression models.