Figures & data
Figure 1. A map of the Falling Creek Reservoir (FCR), located in Vinton, VA. Beaverdam Reservoir (BVR) drains into the primary inflow feeding FCR. Water samples were collected at the deepest site in the reservoir; tributary inflow samples were collected at the weir. Inset shows the approximate orientation of the hypolimnetic oxygenation (HOx) diffuser line.
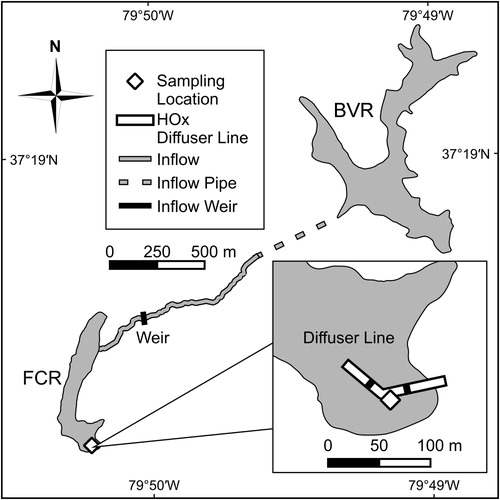
Table 1. Dates of HOx system activation.
Figure 2. Daily change in reservoir volume (top); inflows (tributary, groundwater (GW)/runoff, and precipitation entering FCR; middle); and outflows (spillway discharge, water treatment plant [WTP] withdrawals, and direct evaporation from FCR; bottom) in 2014 (left) and 2015 (right). Horizontal bars above plot indicate periods of elevated tributary and groundwater/runoff inflow.
![Figure 2. Daily change in reservoir volume (top); inflows (tributary, groundwater (GW)/runoff, and precipitation entering FCR; middle); and outflows (spillway discharge, water treatment plant [WTP] withdrawals, and direct evaporation from FCR; bottom) in 2014 (left) and 2015 (right). Horizontal bars above plot indicate periods of elevated tributary and groundwater/runoff inflow.](/cms/asset/dfe64fff-4a1e-49fa-898c-0a1358903cd3/ulrm_a_1545811_f0002_b.jpg)
Figure 3. Mean volume-weighted hypolimnion (VWH) DO concentrations and DO concentrations just above the sediments (“Bottom”; 9.3 m depth) in 2014 (left) and 2015 (right). Vertical dashed and solid lines indicate when the HOx system was activated and deactivated, respectively. Periods of activation (“Oxygenated”) or deactivation (“Non-oxygenated”) are shown in horizontal bars above plot. Note short period of deactivation in late July 2015 that is not visible in the horizontal bar. HOx system turned off in mid-November of both years (not shown on figure).
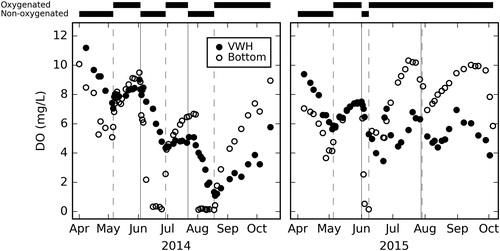
Figure 4. Mass of total Fe (top) and Mn (bottom) in the hypolimnion in 2014 (left) and 2015 (right). Horizontal bars above plot indicate periods when the HOx system was activated (“Oxygenated”) or deactivated (“Non-oxygenated”) and periods of elevated tributary and groundwater/runoff inflow (see ). Note short period of deactivation in late July 2015 that is not visible in the horizontal bar.
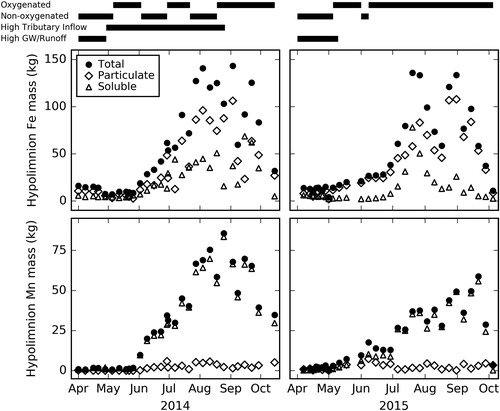
Figure 5. Exchange (Lexch) of total (top) and soluble (bottom) Fe and Mn between sediments and the hypolimnion in 2014 (left) and 2015 (right). Positive exchange indicates release of mass from sediments to the water column exceeds return of metals from water column to sediments. Horizontal bars above plot indicate periods when the HOx system was activated (“Oxygenated”) or deactivated (“Non-oxygenated”) and periods of elevated tributary and groundwater/runoff inflow (see ). Note short period of deactivation in late July 2015 that is not visible in the horizontal bar.
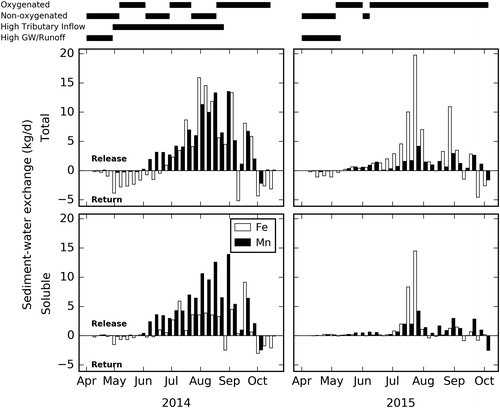
Figure 6. Loading of Fe and Mn in the tributary inflow and outflows (top 4 panels) and net export of total and soluble Fe and Mn (Lnet; bottom 4 panels) from FCR to downstream in 2014 (left) and 2015 (right); left y-axes show Fe data and right y-axes show Mn data. Positive net export indicates reservoir is a metal source to downstream; negative net export indicates reservoir is a metal sink. Horizontal bars above plot indicate periods when the HOx system was activated (“Oxygenated”) or deactivated (“Non-oxygenated”) and periods of elevated tributary and groundwater/runoff inflow. Note short period of deactivation in late July 2015 that is not visible in the horizontal bar.
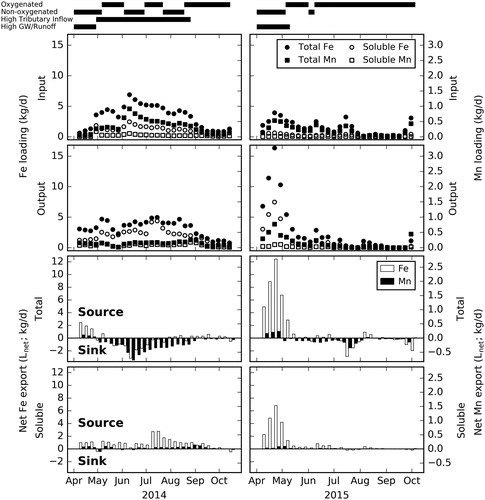
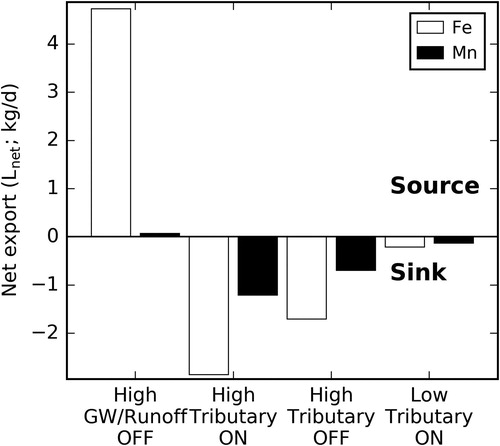
Figure 7. Net export of total Fe and Mn (Lnet) in FCR during 4 field manipulations: high groundwater/runoff and oxygenated (“ON”) conditions (1–28 April 2014 and 1 April–10 May 2015), high tributary inflow discharge and oxygenated conditions (28 April–9 June, 29 June–30 July, and 19–26 August 2014), high tributary inflow discharge and non-oxygenated conditions (“OFF”) (9–29 June and 30 July–19 August 2014), and low tributary inflow discharge and oxygenated conditions (19 August–15 October 2014, 10 May–4 June 2015, and 8 June–5 October 2015). Positive net export indicates reservoir is a metal source to downstream; negative net export indicates reservoir is a metal sink.