
Figures & data
Table 1. Primer sequences (for qPCR and high-throughput sequencing), amplicon size, and annealing temperatures.
Table 2. Kendall’s nonparametric correlations (τ) of molecular data (DNA concentrations and gene copy number per gram of wet sediment) and sediment microcystin content in the Lake of the Woods core.
Figure 1. Lake of the Woods sediment core depth profiles with dating on the right axis of concentrations, on a logarithmic scale. (A) Total microcystin concentrations (ng/g dry weight, from Zastepa et al. Citation2017a) and microcystin gene (mcyD) copy numbers per gram fresh weight (f.w.) with detection limits (DL) reached approximately midway down. The dashed vertical lines indicate mean values for both through the core. Solid lines in each case represent LOESS trends. (B) Total DNA (ng/g f.w.), cyanobacterial 16S rRNA gene copy numbers/g f.w., bacterial housekeeping gln A gene copy numbers/g f.w., with dashed lines indicating mean values for each. Solid lines in each case represent LOESS trends.
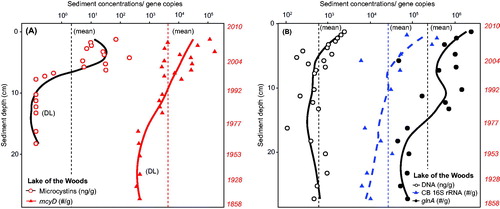
Figure 2. Lake of the Woods through the sediment time series. Gene copy numbers per gram fresh weight as presented in plotted on a logarithmic scale, including Microcystis specific 16S rRNA gene copy numbers. Solid lines in each case represent LOESS trends for each gene. Gray arrow shown post 1980 CE corresponds to the rise in the diatom Cyclotella relative to Aulacoseira, indicative of climate warming (from Rühland et al. Citation2010).
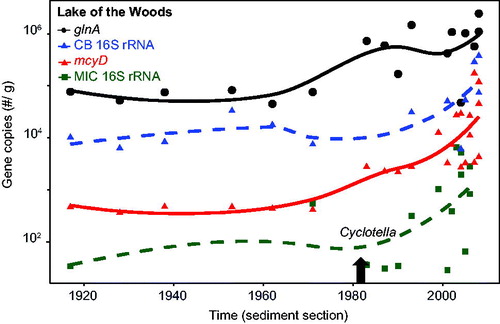
Figure 3. Baptiste Lake South (Alberta) sediment core depth profiles of total microcystins concentrations (ng/g d.w., from Zastepa et al. Citation2017b) and microcystin gene (mcyD) copy numbers/g f.w. on a logarithmic scale with corresponding dating on the right axis. Dashed vertical lines indicate mean values for both through the core. See for detection limits. Solid lines in each case represent LOESS trends.
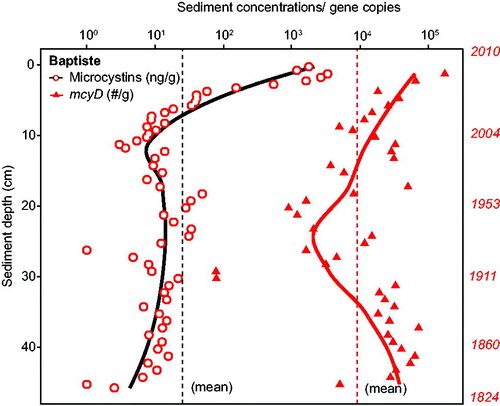
Figure 4. Baptiste Lake South (Alberta) across the sediment core time series. mcyD gene copy numbers as presented in are plotted on a logarithmic scale, along with the bacterial housekeeping gln A, cyanobacterial 16S rRNA, and Microcystis specific 16S rRNA gene copy numbers/g f.w. Solid lines in each case represent LOESS trends. Gray arrow shown in early post 2000 CE corresponds to the rise in the diatom Stephanodiscus hantzschii, indicative of cultural eutrophication (from Adams et al., Citation2014).
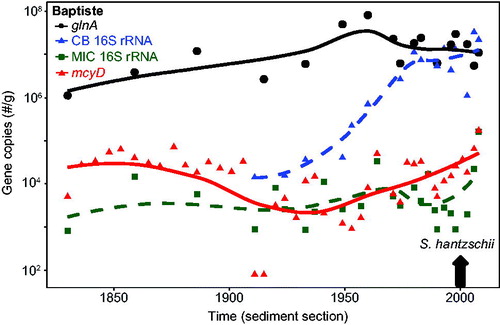
Table 3. Kendall’s nonparametric correlations (τ) of molecular data (DNA concentrations and gene copy number per gram of wet sediment) and microcystin content in the Baptiste Lake core.
Figure 5. Taxa in Baptiste Lake South at selected intervals of the sediment core as determined from high-throughput sequencing of the 16S rRNA gene using primers specific to cyanobacteria (). Proportions of the main taxa are presented at the level of order (A) and separated further into genera within the Nostocales (B) and Chroococcales (C) orders. Genera containing potentially toxigenic species dominate in both cases.
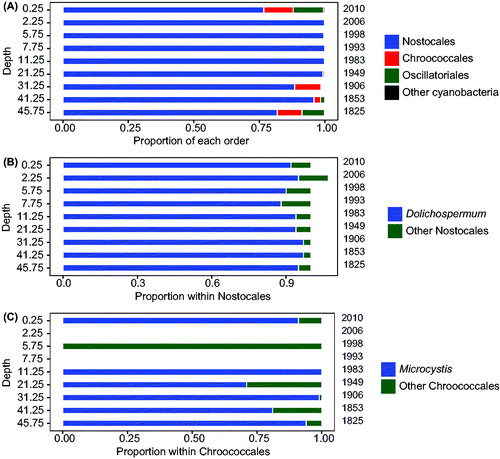
Table 4. Operational taxonomic units (OTUs based on 97% sequence similarity) and Shannon diversity index through the Baptiste Lake core.