
Figures & data
Figure 1. Surface temperature and water depth measured at the sampling site in Lacamas Lake, Washington from May 2013 to February 2017.
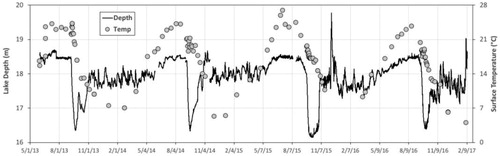
Figure 2. Vertical distribution of (A) temperature and (B) Chl-a in Lacamas Lake, Washington over the 4 year study period (2013–2016) collected with the Sonde. The sampling depths and times are indicated with black circles in (A) (These depths also apply to the data in (B), but for clarity are only shown on in (A)). The weighted mean depths (WMDs) of Chl-a at each time period are indicated with black triangles in (B). Vertical black lines separate years, and vertical gray lines indicate the timing of annual drawdown events each autumn.
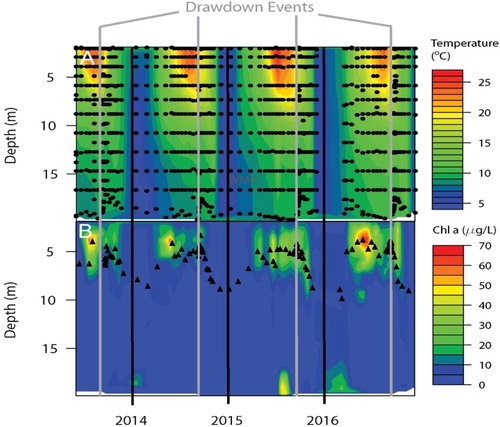
Figure 3. Monthly mean (± standard error) depth of the thermocline (red triangles) and the Chl-a maximum (green circles) during 2013–2016 in Lacamas Lake, Washington.
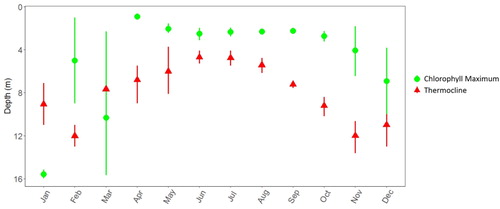
Figure 4. Vertical distributions of size-fractionated Chl-a concentrations in Lacamas Lake, Washington in (A) August, 2015 and (B) October 2015. Both midnight (black bars, left) and midday (gray bars, right) data are shown. The circles represent the mean weighted mean depth (WMD) for each size fraction. Of all the midday versus midnight comparisons, only the 2.7–35 µm size fraction in October showed any significant diel difference in mean WMDs (p = 0.0058, n = 3).
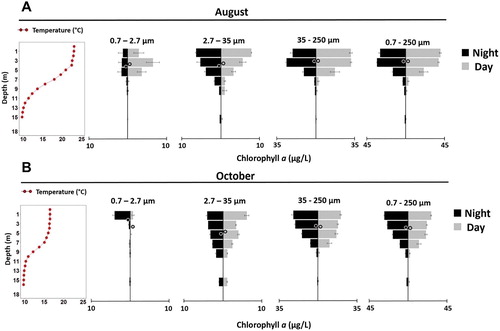
Table 1. Mean (± standard error) weighted mean depths (WMDs) in meters of each of 4 size fractions of Chl-a in August (pre-spill) and October (post-spill) 2015, and the difference in mean WMDs between the 2 dates, in Lacamas Lake, Washington, assessed using Student’s t-tests. (*** = p < 0.001, n = 6 [3 midday and 3 midnight samples were combined for each date]).