Figures & data
Figure 1. Columbus Lake, a 3600-ha reservoir in northeast Mississippi. The map shows the distribution of 27 shaded and unshaded sites sampled in the upper reaches of the reservoir over 24-h periods between 11 June and 13 August 2015. Sampling sites were distributed in shores facing south (unshaded) or facing north (shaded). Because of the angle of the sun, as it travels in clockwise fashion (illustrated in the upper end of the figure), shores facing south receive direct sunlight for 12–13 h, and shores facing north are sheltered from direct sunlight for 12–13 h.
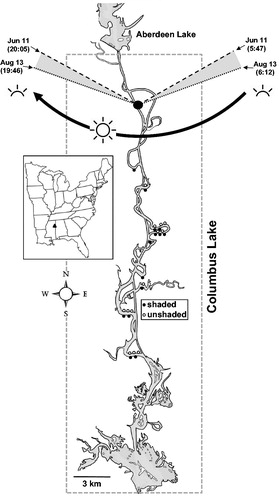
Table 1. Mean and minimum–maximum (in parentheses) of 10 water quality variables recorded in shaded (N = 13) and unshaded (N = 14) sites over 24-h periods in Columbus Lake, Mississippi, 11 June–13 August 2015. Also shown is the statistical significance (P value) for regression coefficients b1–b8 listed in Equationequation 1(1)
(1) and fitted to each of the water quality variables. A statistically significant (P < 0.05) coefficient indicates: b1, differences in yt between shaded and unshaded sites; b2, sinusoidal diel cycles at different levels of yt; b3, peaks and dips of shaded and unshaded diel cycles at different times; b4, differences in ascending and descending slopes; b5, peaks and dips of different amplitudes; b6, a linear (+/−) effect of DOY; b7, in combination with a significant b6, an arched or curved pattern relative to DOY; b8, a linear (+/−) effect of depth.
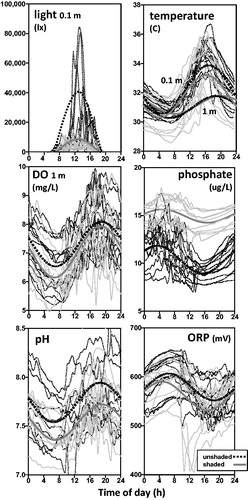
Figure 2. Mean diel patterns of water quality variables recorded in shaded (N = 13) and unshaded (N = 14) sites of Columbus Lake, Mississippi, June–August, 2015. The curves represent individual samples; the heavier curves represent the predicted values fitted with Equationequation 1(1)
(1) . In the temperature panel, the sample curves represent the 0.1-m data. DO = dissolved oxygen and ORP = oxidation–reduction potential. Turbidity, specific conductance, and nitrate are not shown because no diel patterns were detected.