Figures & data
Figure 1. Mean biomass concentrations (± se) by month for (A) Daphnia pulicaria and (B) D. mendotae in whole water column samples for years when trout were stocked (white bars) and moratorium years when trout were not stocked (black bars). Horizontal lines (dashed for trout years, solid for moratorium years) are grand means across all month periods. Two-factor ANOVA p values for main effects (trout, month) and the interaction between trout and month on log10 biomass are included in each panel (asterisk for the D. mendotae trout × month p value indicates that that p value did not meet the statistical significance threshold after application of the Bonferoni correction). Data are plotted on logarithmic scale.
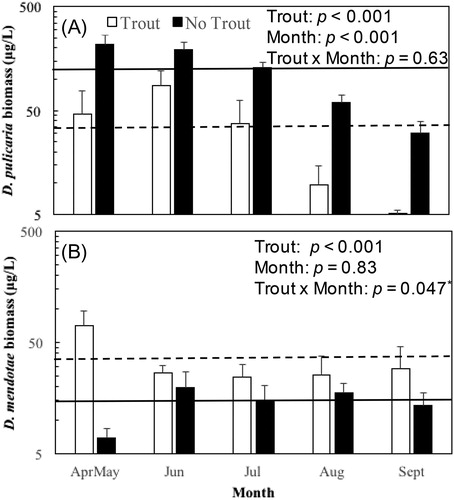
Figure 2. Mean biomass concentrations (± se) for Daphnia pulicaria and D. mendotae in discrete depth samples between trout years and moratorium (no trout) years. Daphnia pulicaria biomass concentrations increased substantially during the moratorium (particularly in the upper and lower metalimnion sampling depths), while D. mendotae biomass levels decreased at all depths during the moratorium. Data plotted on logarithmic scale.
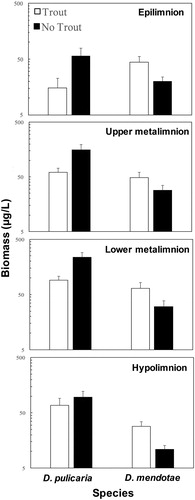
Figure 3. Mean levels (± se) for trophic state indicators (SDT, Chl-a, hypoxic volume, and TP) by month for years when trout were stocked (white bars) and moratorium years when trout were not stocked (black bars). Horizontal lines (dashed for trout years, solid for moratorium years) are grand means across all month periods. Two-factor ANOVA p values for main effects (trout, month) and the interaction between trout and month are included on the panels for SDT, Chl-a, and TP. The asterisk on the trout effect p value for Chl-a indicates that that p value did not meet the statistical significance threshold after application of the Bonferoni correction. Note that the y-axis scale is logarithmic for Chl-a (panel B) and TP (panel D).
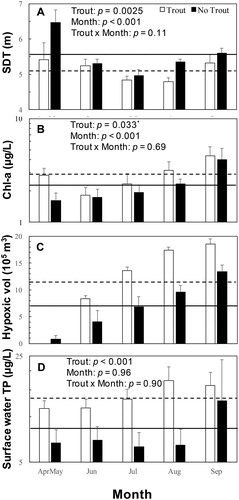
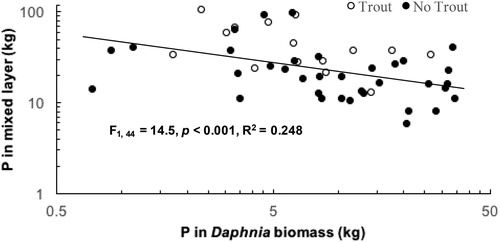
Figure 4. TP in mixed layer versus P in Daphnia biomass (plotted on log scale). White circles are from dates in premoratorium years and black circles are from dates in moratorium years. The simple linear regression of log10 mass of P in the mixed layer versus log10 mass of P in Daphnia biomass shows that mixed layer P mass decreased significantly as P in Daphnia biomass increased (F1, 44 = 14.5, p < 0.001, R2 = 0.248).