Figures & data
Table 1. Study site classifications, locations, and average TP estimations with associated error for both digestion methods.
Table 2. Comparison of TP recovery from third-party QC reference material.
Figure 1. Comparison of log-log transformations of inline-UV and autoclave TP digestion methods. Points represent mean of triplicate samples. Solid black line represents best fit linear model (p < 0.001, R2 = 0.8110) and gray polygon represents 95% confidence intervals. Dotted line represents a 1:1 relationship between methods.
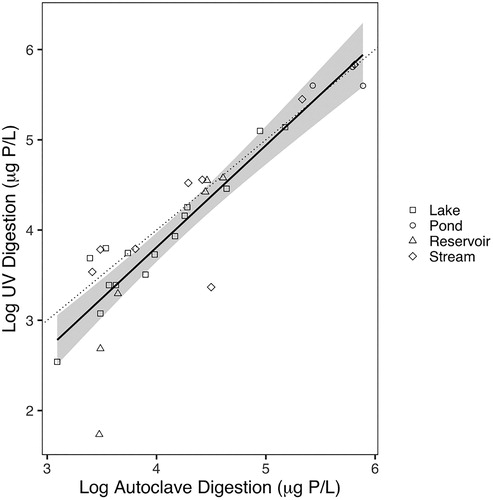
Figure 2. Histogram of percent difference between TP digestion methods for all samples (n = 96). Grey bar represents samples that displayed <10% difference between methods (n = 34), and white bars outlined in black represent samples that displayed >10% difference (n = 62).
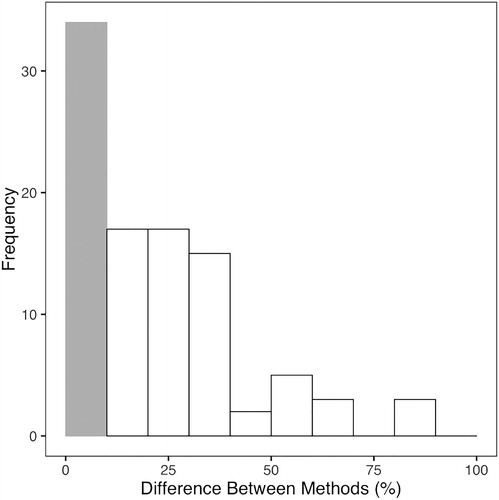
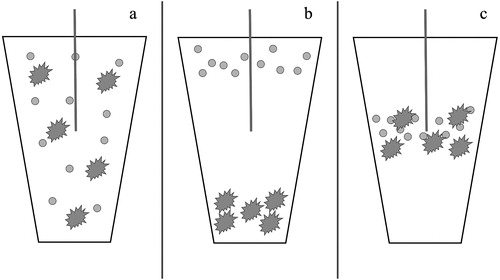
Figure 3. Graphical representation of (a) homogenized sample within a sample cup, (b) possible separation of positively and negatively buoyant particles within sample cup leading to underestimation of TP, and (c) possible congregation of neutrally buoyant particles within sample cup leading to overestimation of TP concentration.