Figures & data
Table 1. Summary of reservoir management actions.
Figure 1. Cut-away schematic of partial-lift hypolimnetic aerators. Air was injected into the bottom of the draft tube, which was open to the lake, creating an air-lift pump. Entrained water flowed downward and out through ports radially distributed at the bottom (12 total). Air is vented out of the top. Aerators were buoyant and anchored to the bottom. Draft tube length was approximately 9 m.
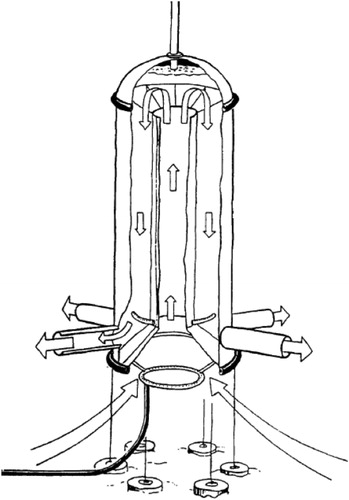
Figure 2. Hypolimnetic oxygenation diffuser placement montage in Vadnais. Diffusers run off the vaporization pressure of liquid oxygen. After manufacture at the lake side, diffusers were placed over deep holes and sunk to position by flooding the ballast pipe. (Photo credit: Jacobs. Schematic: Mobley Engineering, Inc.).
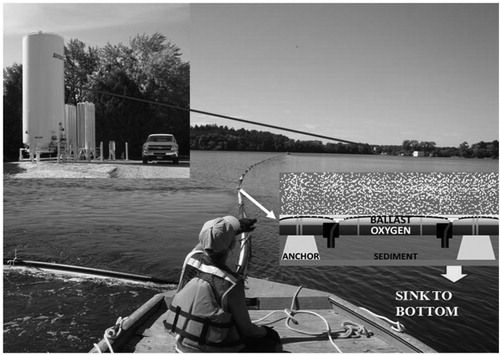
Table 2. Method summary.
Figure 3. Temperature isopleths for Vadnais (left) and Pleasant (right). Dots are data points. The bottom meter is truncated from plots to avoid interpolation errors from missing data points. Pleasant hypolimnetic mean temperature is warmer than for Vadnais because of Mississippi River inflows.
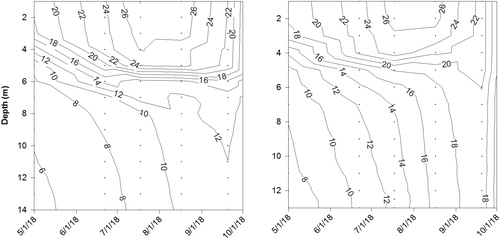
Figure 4. Pleasant partial destratification under first year gas flux rate.
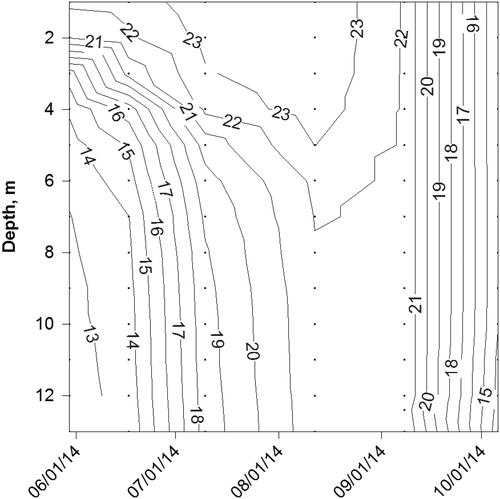
Table 3. Summer mean daily oxygen delivery rates. Normal cubic meters per hour (Nm3/h) is converted directly from standard cubic feet per minute (scfm).
Figure 5. Pleasant (left) and Vadnais (right) hypolimnetic DO (mg/L) at 10–15 m depth, Jun–Aug. Note that Vadnais had no HA nor HO in 2011.
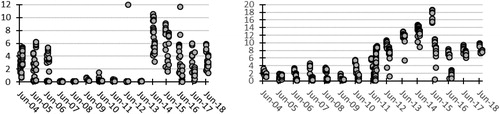
Figure 6. Pleasant (left) and Vadnais (right) hypolimnetic ORP (mV) at 10–15 m depth, Jun–Aug. Note that aerators were removed from Vadnais in May 2011. HO was commissioned in October 2011.
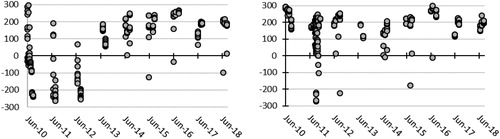
Figure 7. Pleasant (left) and Vadnais (right) summer (Jun–Sep) hypolimnetic total Fe.
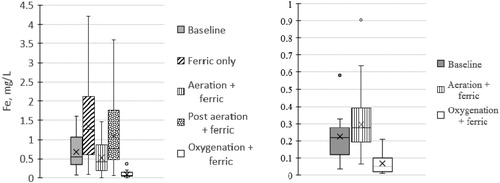
Figure 8. Pleasant (left) and Vadnais (right) summer (Jun–Sep) hypolimnetic total Mn.
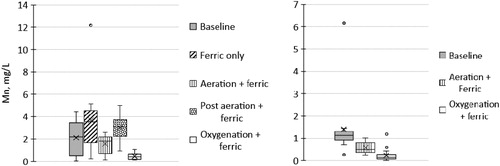
Figure 9. Pleasant (left) and Vadnais (right) summer (Jun–Sep) hypolimnetic total phosphorus.
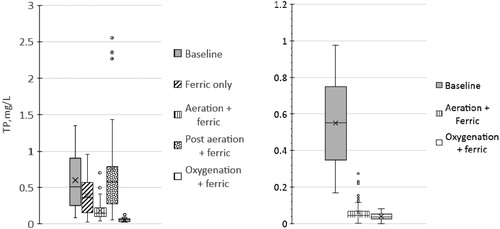
Figure 10. Summer (Jun–Sep) surface TP distribution in Pleasant (left) and Vadnais (right).
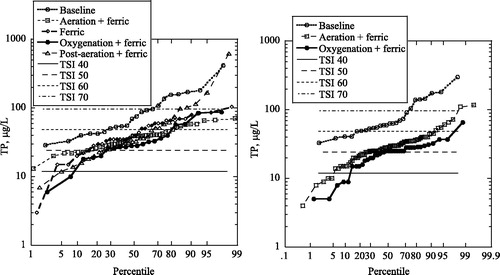
Figure 11. Summer (Jun–Sep) chlorophyll-a distribution in Pleasant (left) and Vadnais (right).
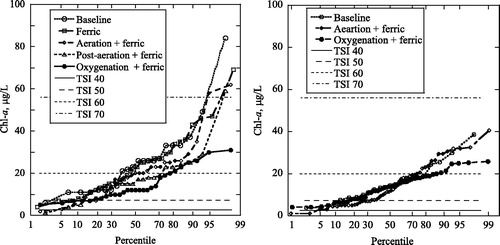
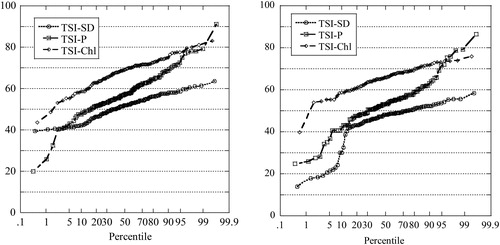
Figure 12. Distribution of trophic state indices 1984–2018 in Pleasant (left) and Vadnais (right), Jun–Sep values.