
Figures & data
Figure 1. Lake Sammamish and tributary streams on the east and west side and Issaquah Creek subbasins.
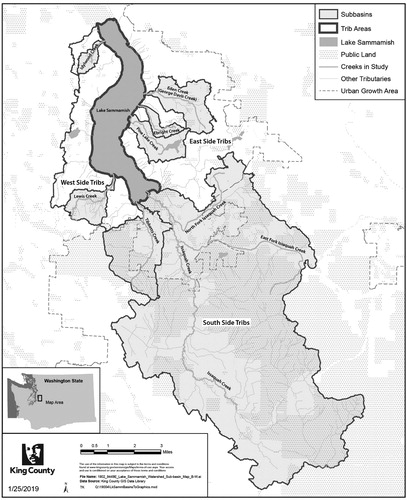
Figure 2. Annual average Issaquah Creek flow (calendar year) from 1964 through 2012.
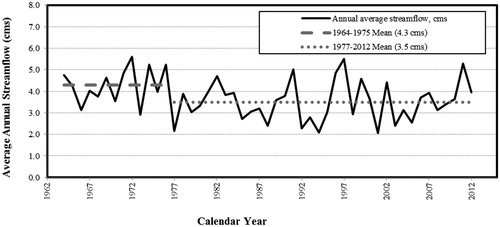
Figure 3. Total single family, multifamily, and commercial developed land in the Sammamish watershed from 1900 to 2011 based on total “as-built” area in hectares for the specified time period.
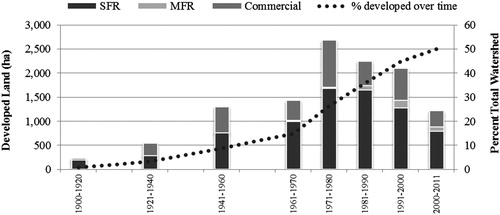
Figure 4. Mean annual whole-lake volume-weighted TP and SRP. TP data compared with lake management goal of 22 µg/L and projected full build-out (Perkins et al. Citation1997). Arrow indicates wastewater diversion in 1968. Note: Data for 1964–1966 from METRO (Isaac et al. Citation1966); 1970–1975 from University of Washington (UW) Department of Civil Engineering (Welch Citation1977, Welch et al. Citation1980); 1982–2011 from King County (Welch and Bouchard Citation2014). Summer data only in 1981 so not included in annual means. Significant declining TP 1964–2011 (P < 0.01) and SRP 1982–2011 (P < 0.01). No significant trends in TP 1982–2011 or 1995–2011 (P > 0.10).
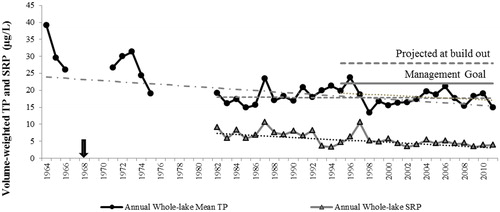
Table 1. Mean annual whole-lake, winter whole-lake, summer hypolimnion (Jun–turnover), and summer epilimnion (Jun–Sep) total phosphorus (TP) during equivalent periods. All values are volume-weighted (µg/L). Wastewater diversion was in 1968.
Figure 5. Volume-weighted mean summer hypolimnetic (Jun–turnover) TP and SRP and maximum TP (triangles). Arrow indicates wastewater diversion in 1968. Data for 1964–1966 from METRO (Isaac et al. Citation1966); 1970–1975 from UW Department of Civil Engineering (Welch Citation1977, Welch et al. Citation1980); 1982–2011 from King County (Welch and Bouchard Citation2014). Significant declining TP 1964–2011 (P < 0.01) and 1981–2011 (P < 0.05); SRP 1982–2011 (P < 0.01).
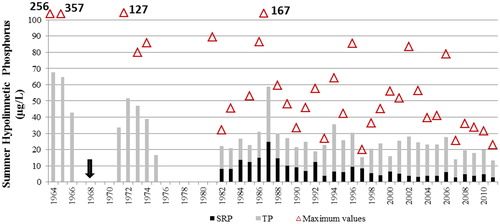
Table 2. Mean (± SD) sediment P release rates in mg/m2 per day for equivalent time periods. Wastewater diversion was in 1968.
Figure 6. Mean summer (Jun–Sep) epilimnetic TP and SRP concentrations. Arrow indicates wastewater diversion in 1968. No significant trends.
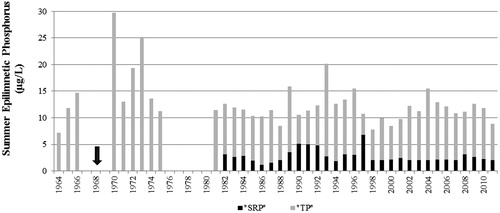
Figure 7. Mean annual whole-lake specific conductance (µS/cm) and alkalinity (mg/L CaCO3). Alkalinity for 1984 and 1989 not included due to insufficient data. Alkalinity averaged 33 mg/L in the early 1970s (Welch Citation1977). Significant increasing trends for both parameters (P < 0.01).
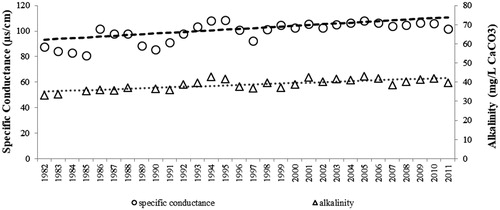
Table 3. Impervious area (ha) in the east, west, and Issaquah basins in 1991 compared with 2011 using the 1991 and 2011 NOAA Coastal Change Analysis Program (C-CAP) data.
Table 4. Mean (±SD) summer (Jun–Sep) epilimnetic TP and Chl-a in µg/L, and Secchi disk transparency (m) during equivalent time periods. Pre-1995 data from King County (Citation1995). Wastewater was diverted in 1968.