Figures & data
Table 1. Frequency distributions of trophic state parameters and temperature measured in individual water samples collected from Denmark (N = 10,658), Florida (N = 318), and during the U.S. Environmental Protection Agency’s (USEPA) National Lake Assessment (NLA) surveys (N = 2187). Numbers in parentheses are values from a randomized database where 200 samples each were taken from Denmark, Florida, and the NLA.
Table 2. Frequency distributions of phytoplankton groups measured concurrently with chemical and physical limnological state parameters in individual water samples collected from Denmark (N = 10,658), Florida (N = 318) and during the U.S. Environmental Protection Agency’s National Lake Assessment survey (N = 2,187). Numbers in parentheses are values from a randomized database where 200 samples each were taken from Denmark, Florida, and the NLA.
Figure 1. Plots and regression equations for log10-transformed total phytoplankton biovolume (mm3/L) versus log10-transformed chlorophyll (µg/L) for all data and by location using paired samples from Denmark (N = 10,658), Florida (N = 318), and during the U.S. Environmental Protection Agency’s National Lake Assessment survey (N = 2187).
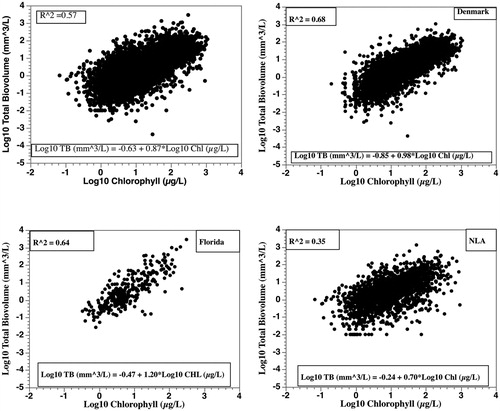
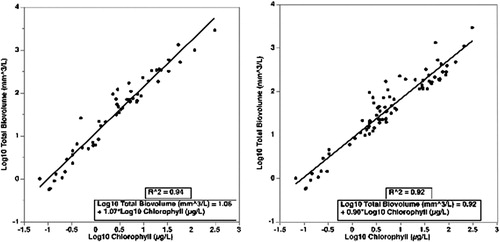
Figure 2. Plots and regression equations for log10-transformed data points along the upper continuum of the total phytoplankton biovolume (mm3/L)–chlorophyll (µg/L) relationship for all data (left) and July/August data (right) for paired samples from Denmark (N = 10,658), Florida (N = 318), and during the U.S. Environmental Protection Agency’s National Lake Assessment survey (N = 2187).