Figures & data
Figure 1. Site map. Depth contours after Adirondack Lakes Survey Corporation data collected in 1985 (ALSC Citation2018). 17A: location of core used for diatom-based pH reconstruction. J2 (Toxaphene): location of core used to test for the presence of residues from piscicide treatment in 1958.
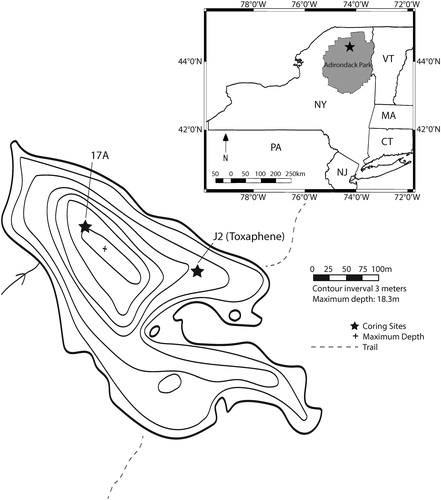
Table 1. Surface pH units (air equilibrated), Secchi disk depth, and DOC measurements from Bear Pond.
Figure 2. Lead-210 activity, dry mass profile, and age–depth relationship for the 17A core.
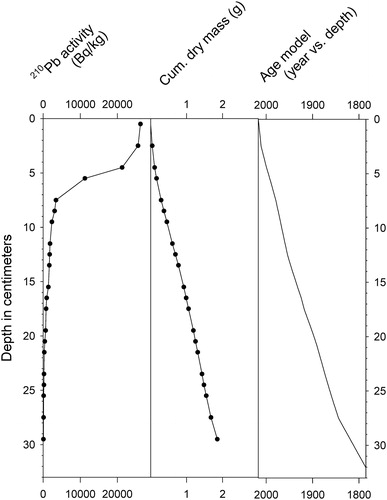
Figure 3. Stratigraphic summary of the most common diatom taxa in the 17A core, along with percent weight loss on ignition (LOI) and ratios of chrysophyte scales to diatoms (S:D ×10). Letters and dotted lines indicate assemblage zones A–D, each with estimated dates indicated.
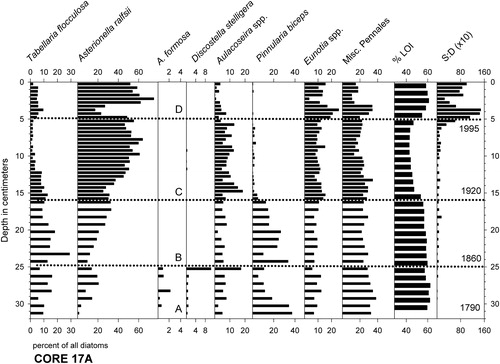
Figure 4. Diatom- and field-based measures of pH history at Bear Pond. (A) Precipitation pH at Huntington Wildlife Forest, Newcomb, NY (NADP Citation2018a). (B) Inferred pH based upon the diatom record of core 17A, with mean and maximum/minimum values indicated by solid and dotted lines, respectively. (C) Percentages of P. biceps in the 17A core, which strongly influenced the inferred pH values. (D) Inferred pH derived from the PIRLA diatom analysis by Charles et al. (Citation1990). Vertical lines indicate (1) 1860 onset of long-term pH decline, (2) 1915 onset of steeper decline, and (3) pH reversal ∼2010.
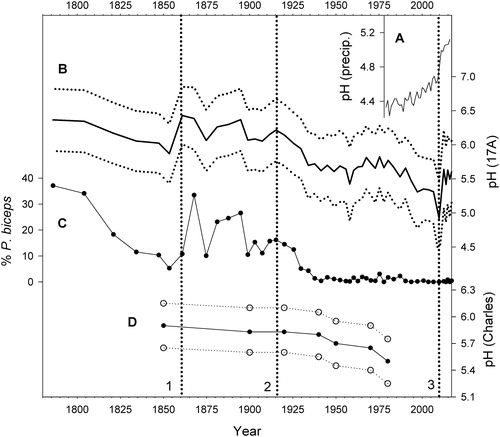
Figure 5. Common diatom genera, ratios of chrysophyte scales to diatoms (S:D × 10), and concentrations of toxaphene in core J2.
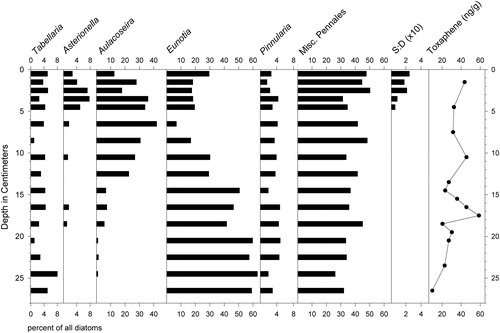
Figure 6. Percentages of A. ralfsii in core 17A plotted with total energy generation from wood, coal, petroleum, and natural gas in the United States (USEIA Citation2019) since the early 19th century.
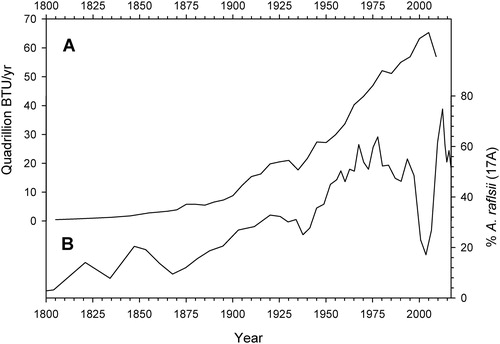
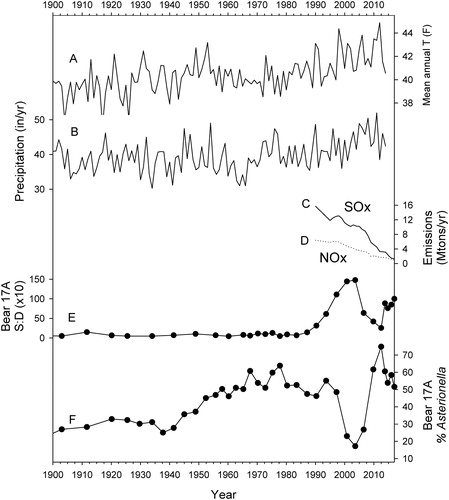
Figure 7. Trends in Adirondack climate, fossil fuel emissions, and major components of the phytoplankton community in Bear Pond during the last century. (A, B) Temperature and precipitation at Lake Placid, NY (USHCN Citation2017). (C, D) Sulfur and nitrogen oxide emissions, respectively, from the electrical power sector of the United States (USEPA Citation2019). (E) Ratio of chrysophyte scales to diatoms in core 17A (S:D × 10). (F) Percentages of A. ralfsii in the 17A core.