Figures & data
Figure 1. 2015 Bathymetric map of Buffalo Lake located in north-central Washington State, managed by the Confederated Tribes of the Colville Reservation. The lake is characterized as a deep, cold oligotrophic lake with a surface area of 225 ha, average annual total phosphorus 0.027 mg/L, average pH 8.1, average summer water temperature <10 C, and Zmax of about 33–38 m. The lake’s variable maximum depth is attributed to the closed, 54.4 km2 basin draining occupied by Buffalo Lake. With no surface outlet and only ephemeral inputs, the lake level is extremely vulnerable to changes in year-to-year precipitation patterns. The annual variability in lake level also has a profound effect on littoral habitat availability throughout the lake, as is evident through its bathymetry. In low-water years, the steep drop-offs from the littoral to pelagic zones become more pronounced, limiting total littoral area. In high-water years, littoral shelves in the lake’s numerous coves become inundated and can even flood riparian vegetation for months. The large littoral shelf in the southern end of the lake contains most of lake’s macrophyte production, consisting of soft mud substrate that crayfish largely avoid. Littoral zone habitat throughout the rest of the lake is dominated by sand, small–large cobble, and bedrock substrates where crayfish abundances have been observed to be highest.
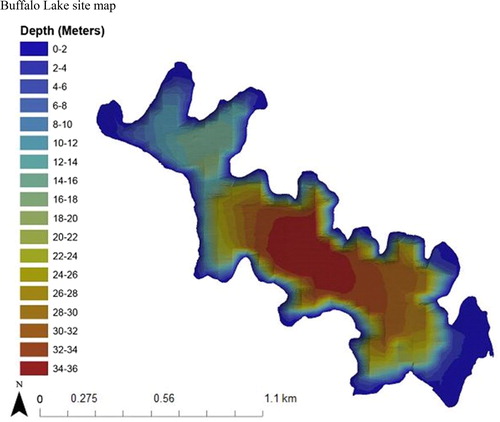
Table 1. Latitude and longitude for 22 baited crayfish trap locations in Buffalo Lake, Washington. Northern crayfish were trapped twice monthly, May–Oct 2017.
Table 2. Latitude and longitude coordinates for monthly littoral macroinvertebrate, juvenile crayfish, and periphyton sampling for 2017 in Buffalo Lake, Washington.
Table 3. Average δ13C and δ15N values and standard deviations for 8 littoral prey items collected May–Oct 2017 and used in SIMMR to quantify proportional diet contributions for Buffalo Lake northern crayfish.
Table 4. Buffalo Lake northern crayfish catch-per-unit effort as a measure of relative abundance, 2015–2018. When water temperatures exceeded 20 C, 20 baited modified gee minnow traps were set overnight in littoral habitats distributed throughout the lake to quantify prey source availability for sport fish. Sampling bias associated with baited traps excludes juvenile crayfish from sample size. To supplement baited traps, littoral kick-net samples in 2016 and 2017 at 8 stratified sites throughout the lake sampled 1 m2 of substrate for 1 min to collect square meter density estimates of juvenile crayfish.
Figure 2. Biplot of δ13C and δ15N values for 8 potential littoral prey sources (n = 110) and northern crayfish (n = 208) collected May–Oct 2017 from Buffalo Lake, Washington. Average δ13C and δ15N values for 1–5 cm CL crayfish size classes are shown to visualize the relationship between crayfish and littoral prey sources. Bivariate isotope plots using the standard error for each prey species’s average δ13C and δ15N values allows the user to interpret the overall food web structure of the Buffalo Lake littoral assemblage. Given trophic fractionation principles that ratios of δ15N will increase 2–8‰ per trophic level and δ13C ratios will increase 0–2‰ per trophic level, we observe that Chironomidae, Ephemeroptera, and detritus probably contribute the most to overall Buffalo Lake northern crayfish diets due to their depleted δ13C and δ15N values compared to crayfish. Periphyton, Amphipod, Odonata, and Hirudinea are generally more enriched in δ13C than crayfish δ13C values, and therefore probably do not contribute as much to overall crayfish diets in Buffalo Lake.
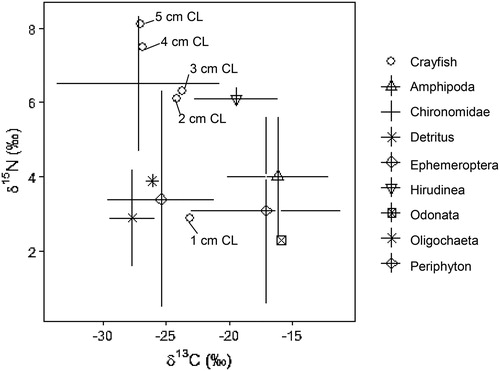
Figure 3. Proportional diet contributions and credible intervals from 8 littoral food sources for 1 cm CL northern crayfish in Buffalo Lake (n = 14). The smallest size class of crayfish obtained for this stable isotope analysis were gathered entirely from kick-net samples in <1 m depth in habitats spatially distributed throughout the lake. The wide distribution in credible intervals implies a large amount of uncertainty in the percent contribution estimates for littoral prey items; however, we conclude juvenile northern crayfish in Buffalo Lake have the most generalist diet compared to the larger size classes, with a dominate proportion of their diet attributed to detritus, periphyton, and Ephemeroptera.
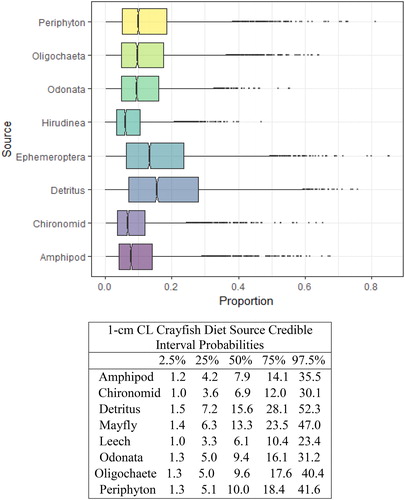
Figure 4. Proportional diet contributions and credible intervals from 9 littoral food sources for 2 cm CL northern crayfish in Buffalo Lake (n = 10). Members of the second smallest size class of northern crayfish obtained for this stable isotope analysis were trapped in baited minnow traps spatially stratified throughout Buffalo Lake in depths ranging from 1 to 5 m. The wide distribution in credible intervals implies a large amount of uncertainty in the percent contribution estimates for littoral prey items; however, we observe a potential ontogenetic diet shift between 1 cm CL and 2 cm CL northern crayfish in Buffalo Lake. From a largely generalist diet anchored by detritus and periphyton to a diet dominated by Ephemeroptera and Chironomidae.
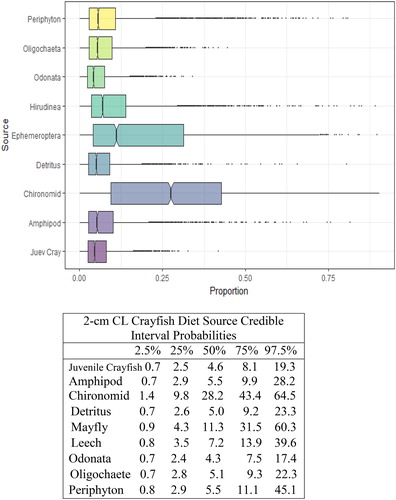
Figure 5. Proportional diet contributions and credible intervals from 9 littoral food sources for 3 cm CL northern crayfish in Buffalo Lake (n = 42). Members of the 3 cm CL size class of northern crayfish obtained for this stable isotope analysis were trapped in baited minnow traps spatially stratified throughout Buffalo Lake in depths ranging from 1 to 5 m. The wide distribution in credible intervals implies a large amount of uncertainty in the percent contribution estimates for littoral prey items; however, we observe an increasing shift in diet toward a greater reliance on Ephemeroptera and Chironomidae.
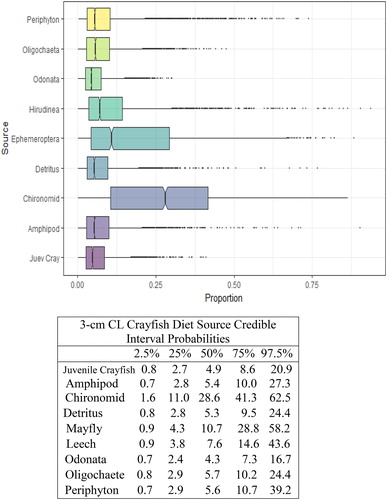
Figure 6. Proportional diet contributions and credible intervals from 9 littoral food sources for 4 cm CL northern crayfish in Buffalo Lake (n = 84). Members of the second largest size class of northern crayfish obtained for this stable isotope analysis were trapped in baited minnow traps spatially stratified throughout Buffalo Lake in depths ranging from 1 to 5 m. The 4 cm CL size class also represents the largest proportion of the total crayfish used for this study. The wide distribution in credible intervals implies a large amount of uncertainty in the percent contribution estimates for littoral prey items; however, we observe that the diet in this size class is now dominated by Ephemeroptera and Chironomidae with limited proportional diet contribution from juvenile crayfish.
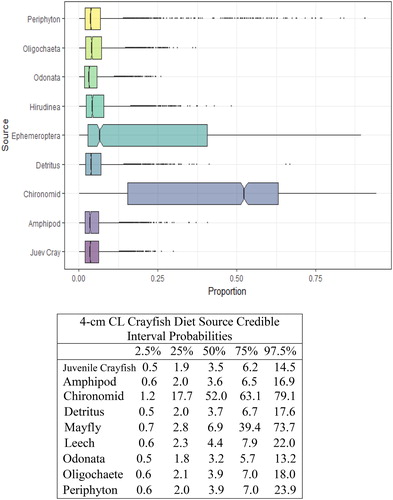
Figure 7. Proportional diet contributions and credible intervals from 9 littoral food sources for 5 cm CL northern crayfish in Buffalo Lake (n = 57). Members of the largest size class of northern crayfish obtained for this stable isotope analysis were trapped in baited minnow traps spatially stratified throughout Buffalo Lake in depths ranging from 1 to 5 m. The wide distribution in credible intervals implies a large amount of uncertainty in the percent contribution estimates for littoral prey items; however, we observe that the diet in this size class is now dominated by Ephemeroptera and Chironomidae with limited proportional diet contribution from juvenile crayfish.
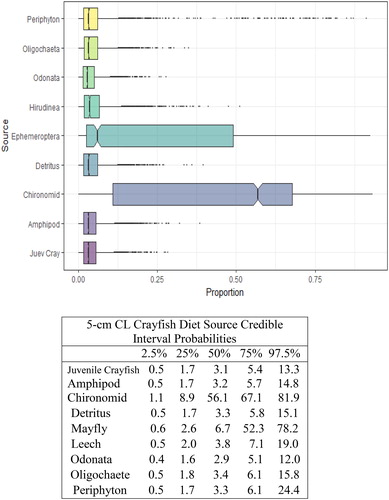
Figure 8. Five 1 cm CL crayfish size classes from Buffalo Lake and the average TP per size class. TP is the metric by which researchers can describe food web hierarchies by observing individual species δ15N values. Adopting the method from Kopanke (Citation2012), crayfish TP was calculated by taking the average δ15N value for each crayfish size class and subtracting the average δ15N value for all littoral prey items, normalized by the δ15N fractionation factor for northern crayfish, 2.2‰, plus the anticipated number of trophic levels crayfish occupy above primary producers, 2. We observed average δ15N ranging from 2.9 to 8.1‰ for smallest to largest crayfish size classes in this study. After calculating size-class-specific TP we observed an ontogenetic trophic shift from 2.2 to 3.2 TPs for 1 cm and 5 cm CL crayfish. Three-order polynomial regression shows a strong relationship between increasing TP with increasing crayfish size, which confirms the ontogenetic diet shift observed in the SIMMR model between 1 cm and 2 cm CL crayfish size classes.
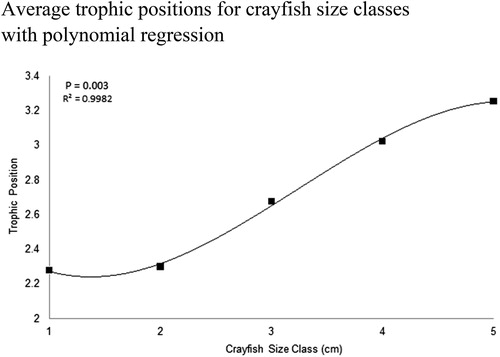
Figure 9. TPs for all northern crayfish (n = 208) analyzed for δ15N from Buffalo Lake in 2017. Error bars represent standard error of mean TP per 1 cm CL size class. Adopting the method from Kopanke (Citation2012), crayfish TP was calculated by taking the average δ15N value for each crayfish size class and subtracting the average δ15N value for all littoral prey items and normalized by the δ15N fractionation factor for northern crayfish, 2.2‰, plus the anticipated number of trophic levels crayfish occupy above primary producers, 2. Although the SIMMR model and polynomial regression indicate an ontogenetic diet and trophic shift among this crayfish population this plot shows the variable TP occupied for each crayfish size class and illustrates the highly plastic feeding behavior crayfish can utilize throughout their life history in Buffalo Lake.
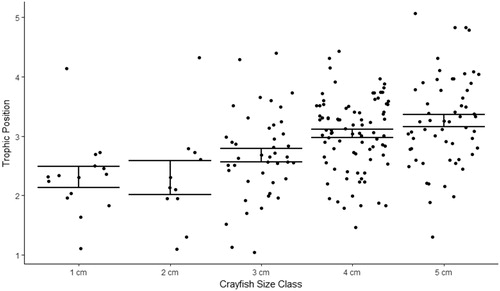
Figure 10. 2017 Buffalo Lake northern crayfish seasonal trophic diversity. Average crayfish δ15N values are highest in spring, when δ15N was 7.45‰, and nearly identical in summer and fall, when δ15N was 6.9 and 6.8‰, respectively. Juvenile crayfish (1 cm CL) δ13C values shift from −30‰ in spring to −15‰ in summer, which is indicative of a shift from allochthonous (detritus) to autochthonous (periphyton) prey sources.
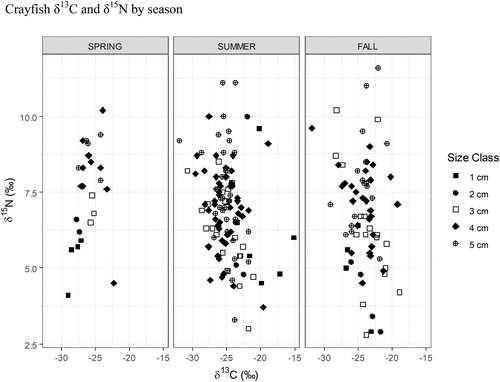
Figure 11. 2017 Buffalo Lake monthly littoral macroinvertebrate abundance summed across all taxa. Although not significantly different, seasonal δ15N values for crayfish may be correlated to boom/bust of littoral macroinvertebrate abundances observed throughout spring, summer, and fall. As is evident by the SIMMR model, this northern crayfish population relies heavily on littoral macroinvertebrates for a large proportion of their diet. The wide distribution of seasonal δ15N values and size class trophic positions demonstrates the highly plastic feeding behaviors that allow Buffalo Lake to consume detritus and periphyton when macroinvertebrates are not as abundant.
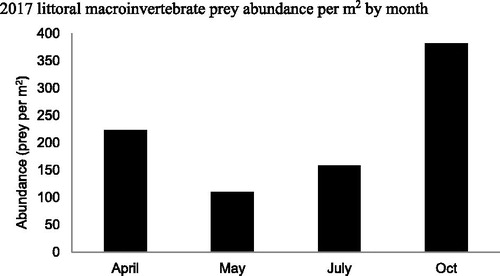
Table 5. Buffalo Lake 2016–2017 seasonal average littoral macroinvertebrate abundance per square meter. Eight littoral sites distributed throughout the lake were sampled quarterly for sport fish prey abundance estimates. Samples were gathered by agitating a 1 m2 area of substrate for 1 min and netting continuously with a 1 m2 kick-net. Macroinvertebrates were sorted to order and enumerated per site for square meter abundance estimates.
Figure 12. 2017 Buffalo Lake northern crayfish trophic diversity as factor of habitat type. SAND = sand/silt, LRB = bedrock or rocks >30 cm, SRG = gravel/rocks <30 cm, SPG = small plant growth <30 cm/emergent vegetation, and LPG = large plant growth >30 cm. Crayfish trapped in SAND, LRB, and SRG have the highest average δ15N values of 6.96‰, 7.15‰, and 7.03‰, respectively. Crayfish trapped in SPG and LPG had the lowest average δ15N values of 5.83‰ and 6.57‰, respectively. One-way ANOVA for habitat as a factor of δ15N values, P = 0.06. Post hoc analysis of one-way ANOVA detected a significant difference in δ15N values between SPG and LRB (P = 0.03).
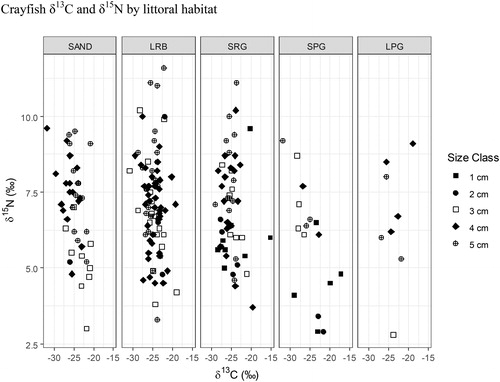
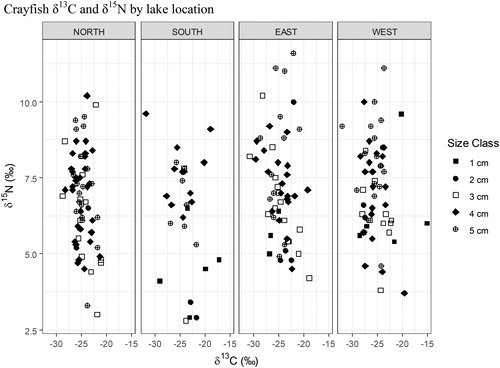
Figure 13. 2017 Buffalo Lake northern crayfish trophic diversity by lake location. Crayfish trapped along eastern and western lake shorelines have highest average δ15N values of 7.2‰. For crayfish trapped on the northern shoreline the average δ15N was 6.8‰, and for crayfish trapped on the southern shoreline the average δ15N was 6.3‰. One-way ANOVA for location as factor of δ15N values, P = 0.119. Post hoc analysis of one-way ANOVA did not detect a significant difference between locations. Lack of significant differences observed may be attributed to habitat heterogeneity between lake locations and/or crayfish movement between locations.