
Figures & data
Figure 1. Map showing the locations of Tono, Bontanga, and Golinga reservoirs in Ghana.
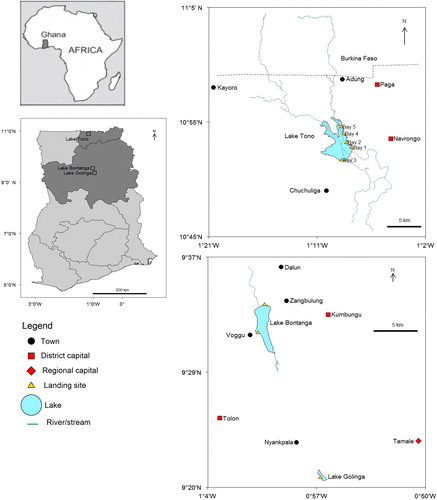
Table 1. Morphometric characteristics of Tono, Bontanga, and Golinga reservoirs.
Table 2. Summary statistics and length‐weight relationships of the target fish species from Bontanga, Tono, and Golinga reservoirs of northern Ghana.
Table 3. Catch (in tonnes) of Coptodon zillii, Oreochromis niloticus, and Sarotherondon galilaeus recorded through field survey at Tono, Bontanga, and Golinga reservoirs from July 2016 to June 2017.
Figure 2. Size distribution of O. niloticus, S. galilaeus, and C. zillii landings observed from July 2016 to June 2017 at Bontanga, Tono, and Golinga reservoirs of northern Ghana. The vertical lines represent the length-based reference values: length at first maturity (dashed line), optimum length Lopt (dotted line), and starting length of mega-spawners (“dot-dashed” line).
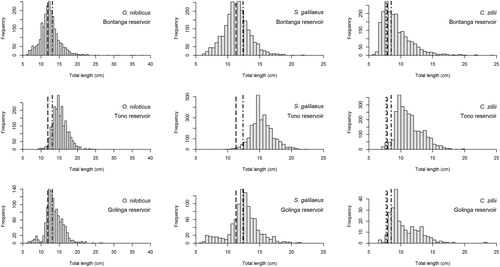
Figure 3. Scatter histogram of bootstrapped ELFFAN with genetic algorithm optimisation for the target species from 3 reservoirs using TropFishR. The points represent the individual combinations of L∞ and K estimates, while the contours represent the density of the combinations. The histograms represent the marginal distributions of the L∞ and K estimates, respectively.
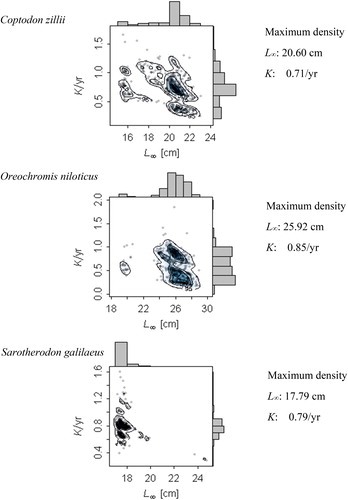
Table 4. Parameter estimates (mode of marginal distribution, Mod) of the seasonally oscillating von Bertalanffy growth function of the target fish species from reservoirs assessed with the bootstrapped electronic length frequency analysis with genetic algorithm function of TropFishR. Estimates based on the pooled length-frequency data of Tono, Bontanga, and Golinga reservoirs collected from July 2016 to June 2017. Lower and upper denote 95% confidence interval of the estimates.
Figure 4. Length-frequency histograms with the growth curves (dashed lines) obtained through the bootstrapped ELEFAN with GA analysis superimposed for Coptodon zillii, Oreochromis niloticus, and Sarotherodon galilaeus. The bars represent the restructured length frequency data, where black bars indicate positive peaks and white bars represent negative peaks. The method tries to maximize the number of positive peaks hit. The faint blue and red colors emphasize positive and negative peaks, respectively.
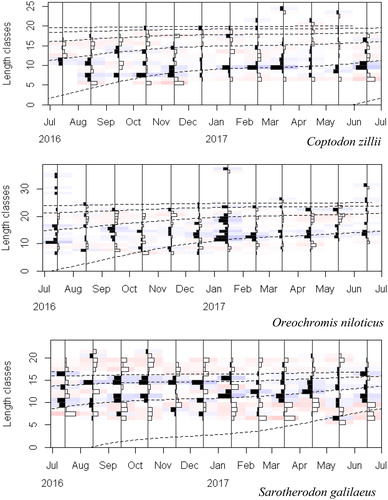
Figure 5. Bootstrapped linearized length-converted catch curve based on 1-yr catch data with selectivity correction. (a) C. zillii-Bontanga, (b) C. zillii-Tono, (c) C. zillii-Golinga, (d) O. niloticus-Bontanga, (e) O. niloticus-Tono, (f) O. niloticus-Golinga, (g) S. galilaeus-Bontanga, and (h) S. galilaeus-Golinga. The circles represent the points of the catch curve, which was applied to each resampled data set. The line represents the regression line corresponding to the maximum density estimates of the 500 estimated catch curves. The blue shaded area represents the 95% confidence interval for the maximum density regression line.
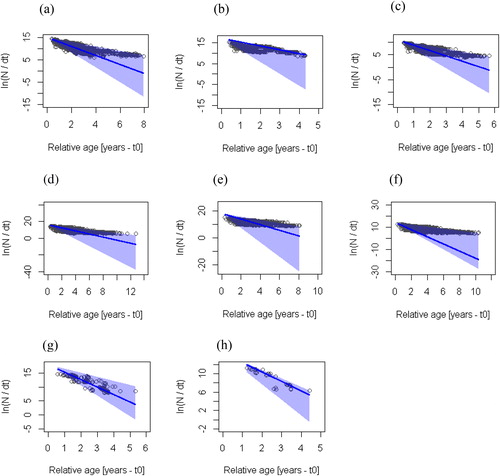
Table 5. Estimated mortality values (Z, M, and F), exploitation rate (E), and biological reference points of fishing mortality (FMSY, Fmax, F0.1, F0.5) for the target species of Tono, Bontanga, and Golinga reservoirs. Mod: mode of the marginal distribution. Low (lower) and Upp (upper) denote 95% confidence interval of the estimates. Estimates are based on the pooled growth parameters with moving average of 5, hence the M estimate of a species is a common value for all reservoirs.
Table 7. Proportions of mature fish (Pmat), optimum-sized fish (Popt), larger than optimum size fish (Pmega), and Pobj (= Pmat + Popt + Pmega) for each species, and from the 3 reservoirs based on the indicators proposed by Froese (Citation2004) and the formulas described in the Methods section. Stock condition interpretation is based on a decision tree proposed by Cope and Punt (Citation2009), aimed to assess whether spawning biomass (SB) is above (>) or below (<) a reference point (RP) of 0.4 unfished biomass. The last column indicates the estimated probability of SB being lower than 0.4 of unfished biomass based on the same authors. For further details refer to Supplemental Table S4.
Table 6. Biomass (in tonnes) of Coptodon zillii, Oreochromis niloticus, and Sarotherondon galilaeus estimated using Jones’s cohort analysis.
Table 8. Growth parameters (L∞ = Asymptotic length and K = Growth coefficient), mortality estimates (Z = Total mortality, M = Natural mortality, and F = Fishing mortality), and exploitation rates (E) from different fishing areas in West Africa, including the estimates of the present study.
Appendix 1. Parameter estimates (mode of marginal distribution, Mod) of the seasonally oscillating von Bertalanffy growth function based on moving averages (MA) of 3 and 7 of the target fish species from reservoirs assessed with the bootstrapped electronic length frequency analysis with genetic algorithm function of TropFishR. Estimates based on the pooled length-frequency data of Tono, Bontanga, and Golinga reservoirs collected from July 2016 to June 2017. Lower and Upper denote 95% confidence interval of the estimates.
Appendix 2a. Estimated mortality values (Z, M, and F), exploitation rate (E), and biological reference points of fishing mortality (Fmax, F0.1, F0.5) for the target species of Tono, Bontanga, and Golinga reservoirs based on the pooled growth parameters with moving average setting of 3. Mod, mode of the marginal distribution; Low (lower) and Upp (upper) denote 95% confidence interval of the estimates. The M estimate of a species is a common value for all reservoirs.
Appendix 2b. Estimated mortality values (Z, M, and F), exploitation rate (E), and biological reference points of fishing mortality (Fmax, F0.1, F0.5) for the target species of Tono, Bontanga, and Golinga reservoirs based on the pooled growth parameters with moving average setting of 7. Mod, mode of the marginal distribution; Low (lower) and Upp (upper) denote 95% confidence interval of the estimates. The M estimate of a species is a common value for all reservoirs.