Figures & data
Table 1. Sample collection schedule and analyses performed 2013 and 2014.
Table 2a. Median, ranges, and interannual comparisons (based on Wilcoxon or similar tests) of microcystin concentrations and qPCR-estimated abundances (as cell equivalents/mL) and ratios of total cyanobacteria, total Microcystis, and mcyE+ Microcystis measured in Upper Klamath Lake in 2013 and 2014. Aphanizomenon cpcA and Microcystis cpcB were quantified in 2014 only. Significant differences (p > 0.05) are in boldface. The “greater than” years without significant p values indicate that values were higher, but the difference between years was not statistically significant.
Figure 1. Changes in copy number (as cell equivalents per mL of water sample) of (A) cyanobacteria 16S rRNA in 2013; (B) cyanobacteria 16S rRNA in 2014; (C) Microcystis 16S rRNA and Microcystis-specific mcyE in 2013; and (D) Microcystis 16S rRNA, Microcystis-specific mcyE, and Aphanizomenon cpcA in 2014. Error bars represent standard deviation. The first day of each month is shown by a vertical line. Asterisk indicates no detection of Microcystis (16S rRNA); + indicates no detection of mcyE.
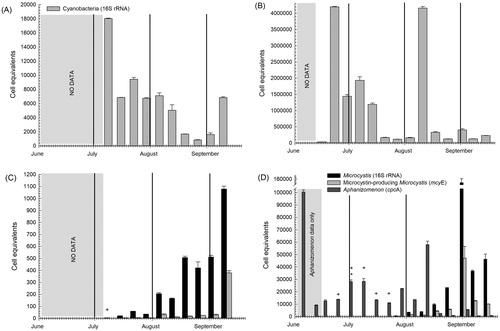
Table 2b. Median, ranges, and interannual comparisons (based on Wilcoxon or similar tests) of environmental parameters measured in Upper Klamath Lake in 2013 and 2014. Significant differences (p > 0.05) are in boldface.
Figure 2. Variations in (A) chlorophyll a concentration, (B) pH, (C) water temperature, and (D) dissolved oxygen concentration in 2013 and 2014. The first day of each month is shown by a vertical line. Water temperature, dissolved oxygen, and pH are average values from the sensors positioned at 3.5 m and 10.5 m in the water column.
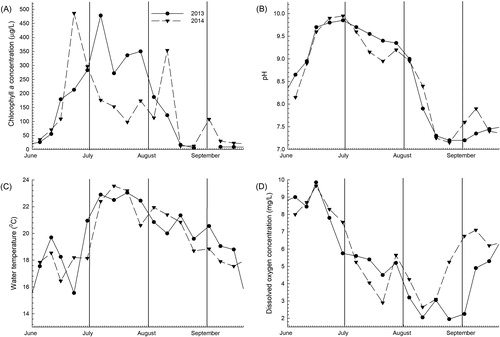
Figure 3. Variations in (A) TN concentration, (B) TP concentration, (C) ammonia concentration, (D) nitrite-plus-nitrate concentration, (E) DIN concentration, and (F) DIP concentration in 2013 and 2014. The first day of each month is shown by a vertical line.
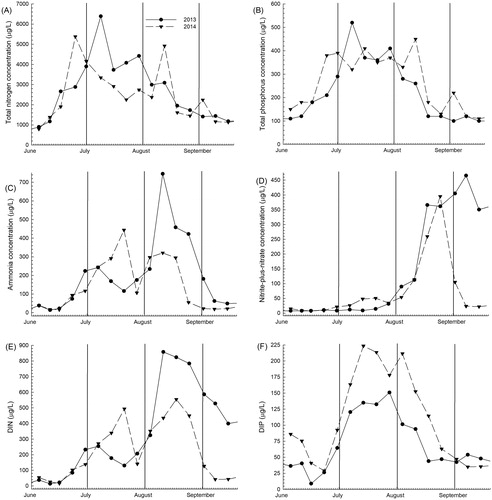
Table 3. Change in total and dissolved nutrient concentrations for time periods leading up to and leading away from maxima TN concentrations in 2013 and 2014.
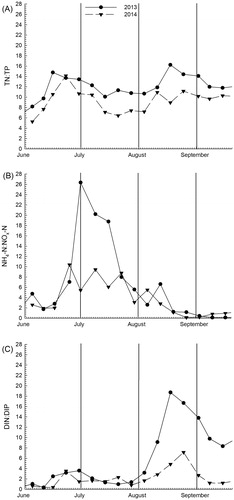
Figure 4. Variations in (A) TN:TP ratio, (B) NH4-N:NOx-N ratio, and (D) DIN:DIP ratio in 2013 and 2014. The first day of each month is shown by a vertical line.