
Figures & data
Table 1. Summary of study sites showing characteristics of each reservoir and oxygenation system.
Figure 1. Images of DO measurements collected in Spring Hollow Reservoir after 24 h of diffuser operation, comparing an idealized plume (top) and a modeled plume (bottom).
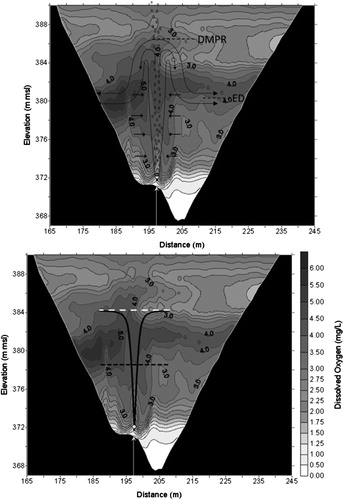
Figure 2. Example of Casitas Reservoir diffuser layout, showing multiple diffusers installed at different elevations and their model predicted zone of oxygenation. Oxygenation is expected in the zone above each dot.
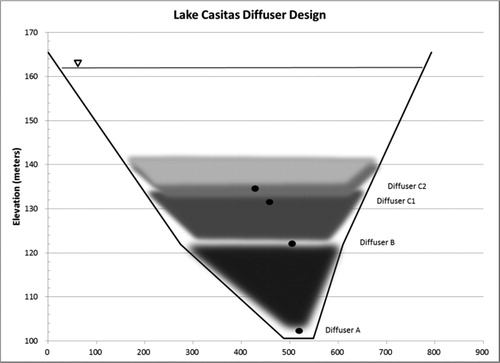
Figure 3. Initial oxygen input observed in Casitas Reservoir following 24 h of operation, showing lateral distribution from diffuser operation. Numbered circles represent plant withdrawal elevations, solid lines show modeled plumes, and dashed lines show corresonding elevation of maximum plume rise (EMPR) and elevation of equal density (EED) for each plume.
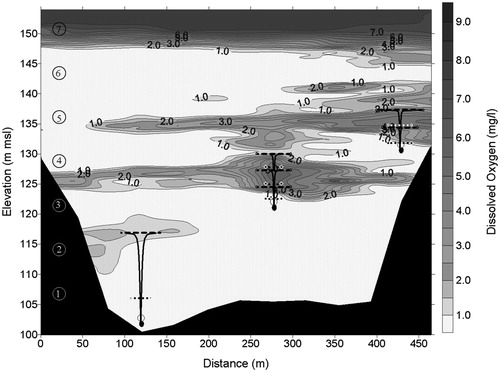
Figure 4. Initial operation DO Increases in Calaveras Reservoir. Dashed lines show historical averages without oxygenation.
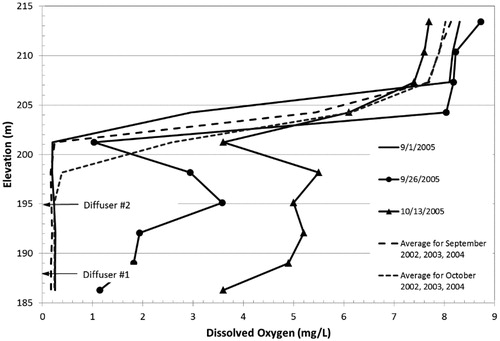
Figure 5. Dissolved oxygen concentrations near the dam at Lake Casitas, showing seasonal anoxia before HOS installation and elevated DO following HOS installation in September 2015.
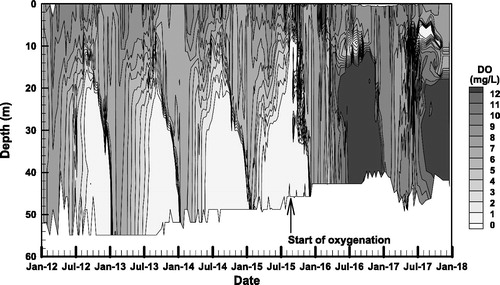
Figure 6. Surface and bottom DO in Aurora Reservoir, showing sustained DO in the bottom waters following diffuser start-up in 2016.
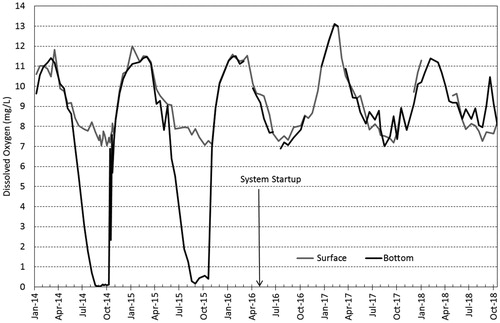
Figure 7. DO by depth for August 2017. In the 2017 operating season, there is a sag in DO in the thermocline layer.
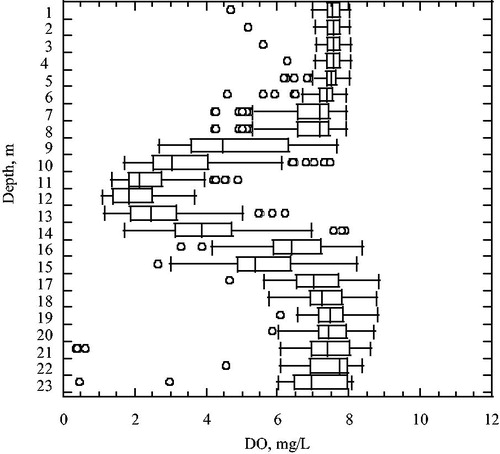
Figure 8. DO by depth for August 2018. In 2018, oxygen input was increased to maintain DO kevels >2.0 mg/L in the thermocline layer.
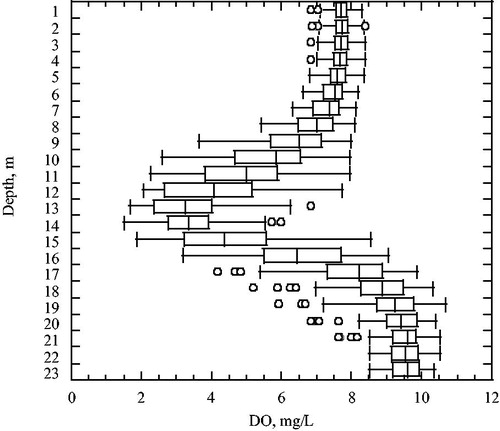
Figure 9. DO data collected 180 m laterally across Carvins Cove Reservoir at the onset of diffuser operation, applying 32 Nm3/h (20 SCFM) to each diffuser. Arrows at ∼45 and 110 m represent diffuser locations.
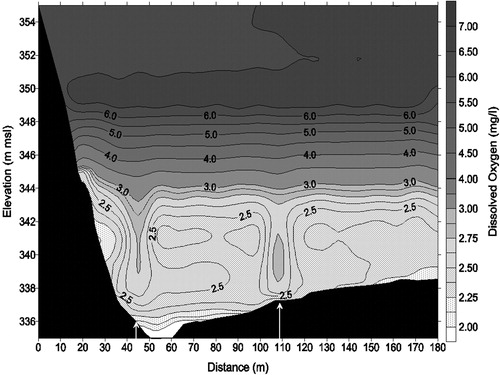
Figure 10. DO data collected 180 m laterally across Carvins Cove Reservoir after 45 d of diffuser operation, applying 32 Nm3/h (20 SCFM) to each diffuser, showing spreading of DO throughout the hypolimnion and over sediment. Arrows at ∼45 and 110 m represent diffuser locations.
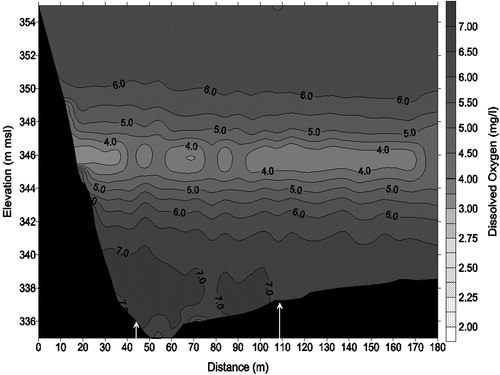
Figure 11. DO data collected horizontally along Carvins Cove Reservoir during 2006, showing horizontal spreading over 2000 m upstream of the diffuser. The diffuser is represented by the white line that extends along the bottom from about 100 to 700 m.
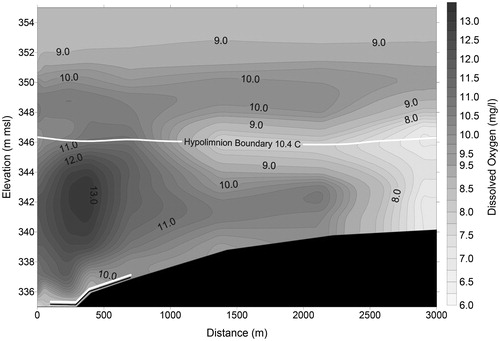
Figure 12. Total Fe concentrations reported throughout the water column in Carvins Cove Reservoir between 2000 and 2009, showing elevated Fe levels each year corresponding to DO dropping below 5 mg/L outlined as DO 5 followed by significant decrease in Fe concentrations after diffuser start-up in 2005.
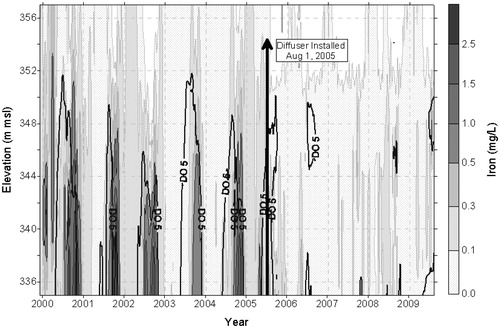
Figure 13. Total Mn concentrations reported throughout the water column in Carvins Cove Reservoir between 2000 and 2009, showing elevated Mn levels each year corresponding to DO below 5 mg/L outlined as DO 5 followed by decreased Mn concentrations throughout the water column after diffuser start-up in 2005.
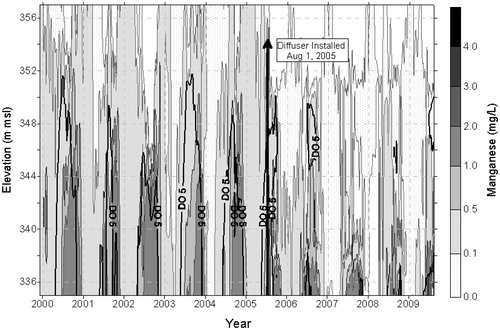
Figure 14. Total and dissolved Mn concentrations collected near the bottom in Aurora Reservoir, showing Mn spikes in excess of 0.500 mg/L prior to diffuser operation, consisting mainly of the dissolved form of Mn, followed by both decreased total Mn concentrations and decreased contribution from the dissolved form of Mn after diffuser installation.
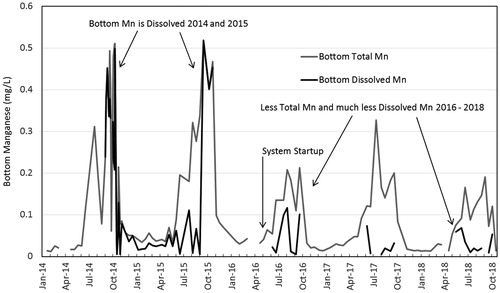
Table 2. Summary of water quality parameters assessed at Lake Casitas from 2012 to 2017.
Figure 15. Total (top) and soluble reactive (bottom) phosphorus collected at the surface and near the bottom in Aurora Reservoir, showing decreased levels of both following diffuser start-up in 2016.
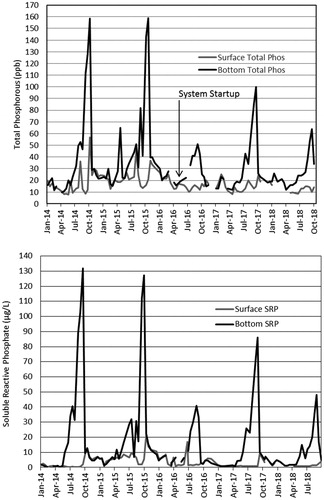
Table 3. Summary table of averaged treatment water turbidity at Lake Casitas during 2015 diffuser operational testing.
Table 4. Summary of turbidity measurements collected in 4 h increments reported by CMWD for 2014–2017. Data provided show minimum, maximum, average, and percentage <0.20 measured.
Table 5. Installation and operating costs.
Table 6. Annual oxygen costs and chemical cost savings at Aurora Reservoir (Benskin Citation2018).