Figures & data
Figure 1. Great Salt Lake System, with Utah Lake draining into the Great Salt Lake via the Jordan River. The southern arm of the lake is further divided by a causeway separating Farmington Bay from the rest of the Great Salt Lake. Sampling locations are shown each of the contributing monitoring organizations.
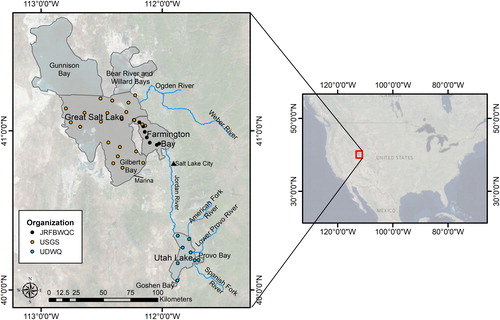
Table 1. Summary data used for model development, application, and analysis.
Figure 2. Modeled versus observed Chl-a, with R2 between modeled and observed values. Differences between the solid regression line and the dashed 1:1 line show the under-/overestimation.
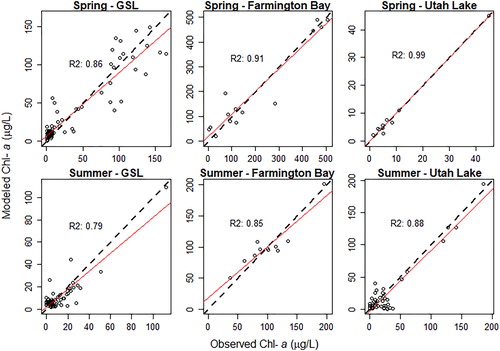
Table 2. Summary of model characteristics and performance. Performance is measured via R2, mean absolute error (MAE), and percent bias (PBIAS) between modeled and observed Chl-a concentrations.
Figure 3. Historical record of Chl-a concentrations between 1984 and 2017 for the sampling locations in the Great Salt Lake System: (A) Utah Lake, (B) Great Salt Lake, and (C) Farmington Bay. The observed data (triangles) are from field samples and the estimated (circles) are from remotely sensed imagery.
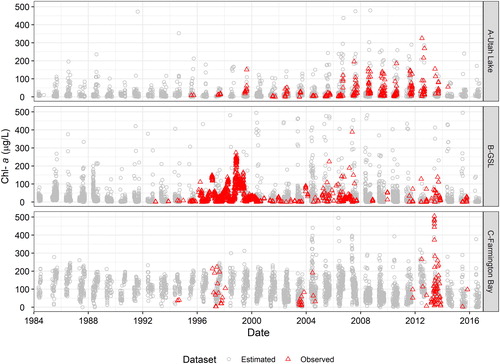
Table 3. Summary of statistically significant (α = 0.05) long-term trends (change per year), calculated using the Theil–Sen estimator from 1984 to 2016.
Figure 4. Magnitudes of trends for lake-wide (A) average (mean) Chl-a, (B) extreme (99th percentile) Chl-a, (C) variability (standard deviation) of Chl-a, and (D) bloom extent (as a percent of lake >50 µg/L). Only statistically significant trends are shown. Note increasing trends in early summer months for average and extreme concentrations, increasing trends in variability for the whole growing season, and increasing trends for bloom extent in the early summer months in the GSL.
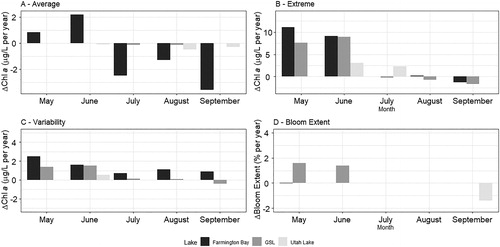
Figure 5. Correlation between lake-wide bloom measures and meteorological parameters, as measured by Kendall’s tau for (A) Utah Lake, (B) GSL, and (C) Farmington Bay. The only significant correlations are between bloom measures and temperature (positive for Utah Lake, and negative for GSL).
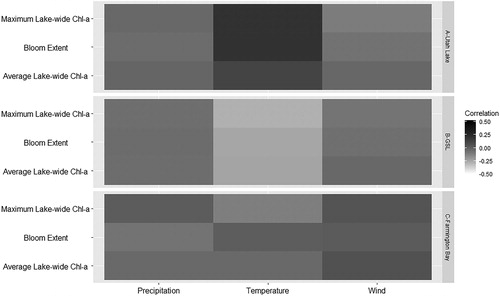
Figure 6. Differences in distributions of Chl-a concentrations for selected sites in Utah Lake, GSL, and Farmington Bay. Chl-a is grouped according to the meteorological conditions of the previous day: (A) precipitation, (B) wind, and (C) maximum air temperature). Note the difference in sensitivity to different meteorological conditions between the lakes and between different locations in the same lake.
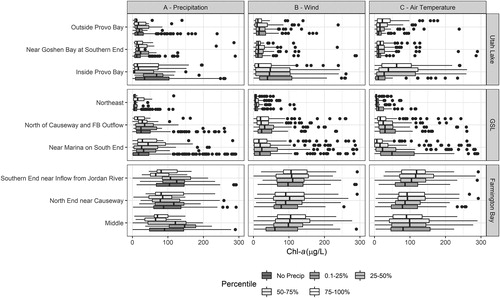
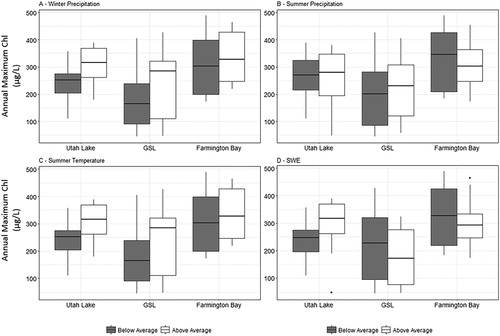
Figure 7. Distributions of annual extreme Chl-a concentrations, grouped by the condition of the seasonal climate parameters: (A) winter precipitation, (B) summer precipitation, (C) summer temperature, and (D) SWE. For Utah Lake, differences in extreme values generally follow the conditions suggested by Page et al. (Citation2018); high Chl-a coincides with high winter precipitation, summer temperature, and SWE.