
Figures & data
Table 1. Morphometric parameters for Camanche Reservoir, California at full pool
Figure 1. Sketch of the Speece cone and ancillary devices installed at Camanche Reservoir (from Brown and Caldwell Citation1995).
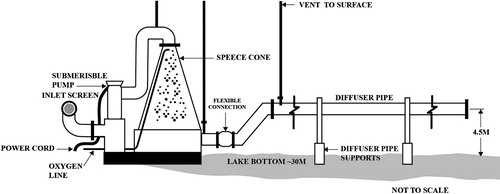
Figure 2. (a) Photograph of Speece cone assembly using a raft near the dam in June 1993. The white cone and green ancillary piping are shown, including T-shaped intake. The water pump is being lowered into the vertical piping. Several workers show scale. (b) Shoreline facilities; ∼10 m high evaporator and 50 m3 liquid oxygen tank; automobile shows scale.
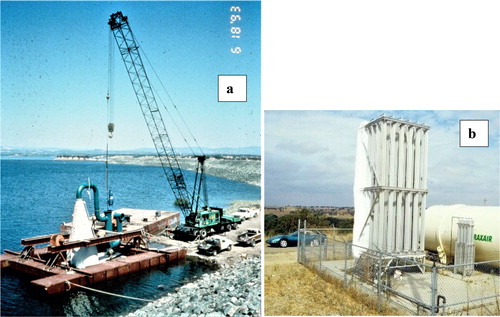
Figure 3. Map of station locations. Multiple repetitive synoptic sampling stations (X), longitudinal stations (numbers 1–5, dam index station is number 1) and Speece cone (Δ) in Camanche Reservoir. Line indicates approximate boundary of thalweg, representing deeper water (>18 m).
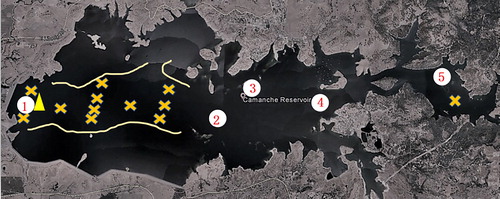
Figure 4. Initial effect of the HOS on deeper water layer. HOS started in partial operation on 23 July 1993 and was in full operation by the 28 July. Squares and gray dotted line correspond to 14 July 1993 before oxygenation; circles and full line represent 28 July 1993 after oxygenation.
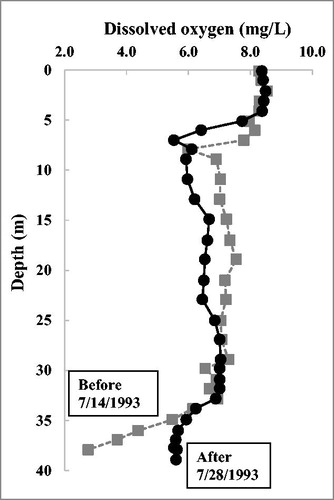
Figure 5. (a) Temperature and (b) dissolved oxygen depth profiles at similar times of year before HOS showing anoxia throughout the hypolimnion before HOS (26 Aug 1992, squares, short dashed line), initial results after about 5 weeks of HOS (3 Sep 1993, triangles, long dashed line) and a profile 21 yr later (17 Sep 2014, circles, gray full line) using about one-third of the oxygen initially added. HOS had little effect on the thermocline, which begins at 6 to 7 m.
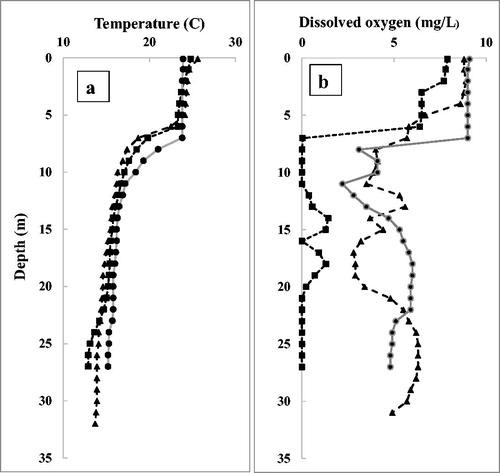
Figure 6. Dissolved oxygen (DO) and temperature at the bottom near the Speece cone during off/on tests in 1993–1994. (a) In 1993 DO rose rapidly and remained constant after HOS was switched on in July 1993. Temperature rose slightly. (b) In 1994 when HOS was switched off DO fell rapidly while temperature rise ceased.
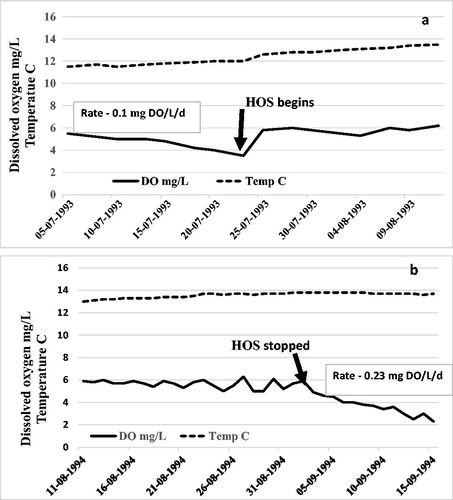
Table 2. Short-term variations in dissolved oxygen and temperature (Temp) for the bottom water (0.5 m above sediments) near the Speece cone for the first few days before and after the HOS was started on 23 July 1993. Also shown is the effect of turning the HOS off in mid-season (2 Sep 1994)
Figure 7. Spatial extent of oxygenation plume during HOS on/off testing in 1994. Most water volume is contained in the first 5 km of the reservoir. (a) Oxygenation shut down for 24 d; most hypolimnion deep water is red (anoxic), and small area of DO ∼1 mg/L near bottom near dam and Speece cone is the remnant of earlier HOS operation. (b) After 29 d of oxygenation. The oxygenated plume (orange yellow >5 mg/L) extended 4.5 km upstream.
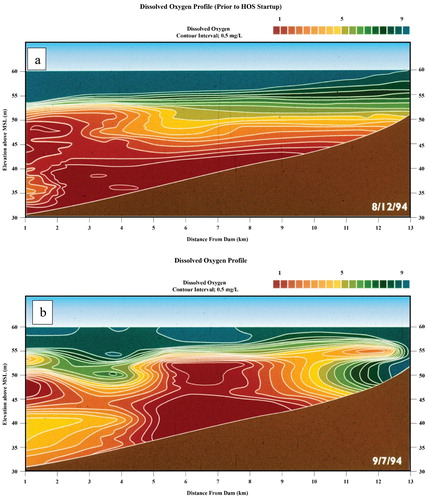
Figure 8. Moving surface, whole-year depth–time isopleths of dissolved oxygen in 2004, 11 yr after HOS installation with less oxygen used. Note: Colors here are reversed relative to ; here blue = low DO and red high DO. The bottom water DO was maintained at >2 mg/L and the mid-upper hypolimnion is almost anoxic in the fall since fish can pass through or around this potential barrier (Horne et al. Citation2019a).
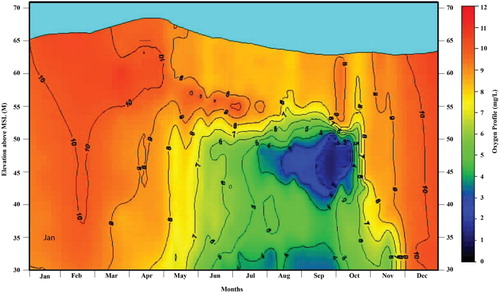
Table 3. Oxidation–reduction potential (ORP in mV) depth profiles at sites near and far from the Speece cone in 1994 (see ). Values in bold = hydrogen sulfide odor smelled by field crew in bottom water samples
