
Figures & data
Table 1. Chemical and biological limnology of eutrophic Camanche Reservoir and trophic state indicators in 1990–1992 prior to HOS
Figure 1. The Camanche Reservoir Speece cone. (a) Diagram of the cone, side view (from Brown and Caldwell, Citation1995). (b) Cone assembly by the dam (Pan Marine Construction). Cone is the large, 7 m high, white structure on right; large inlet and pump pipes to top of cone are dark. Outlet manifold (not shown) attaches to bottom left of cone. (c) Final location of the submerged Speece cone is marked by a buoy (inside triangle) 180 m from dam for which the rock face is at bottom. A 3.5 m long fishing boat (circle) just outside line of small marker buoys shows scale. Photo shows the first 5 km of the reservoir, which holds most of the reservoir volume.
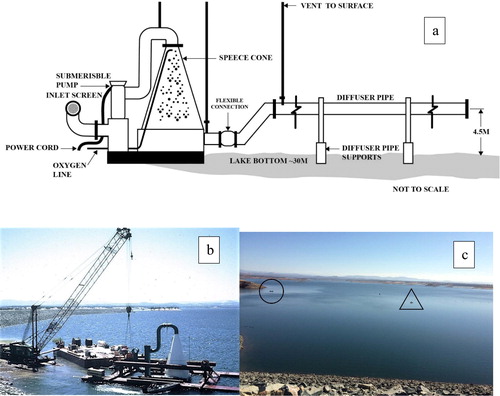
Figure 2. (a) Chlorophyll a and (b) water transparency in Camanche Reservoir during the growth season before and after HOS, which began July 1993. Secchi depth correlation coefficient is based on a third-order polynomial but the R2 for linear regression was similar.
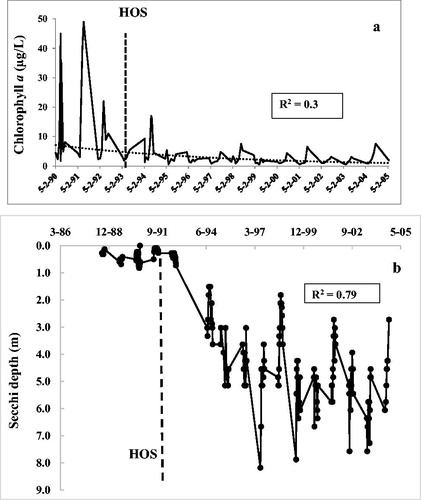
Table 2. Summary of declines in chlorophyll a after HOS for the entire growth season and the key recreational months of July–September.
Table 3. Declines in soluble phosphate (as µg P/L) in the bottom hypolimnion water (2 m above sediment near the dam) before and immediately following HOS in late July 1993
Table 4. Summary of long-term changes in major nutrients (μg/L) in the deep hypolimnion and surface waters of Camanche Reservoir before and after HOS
Figure 3. Phosphorus species in Camanche Reservoir before and after HOS, which began July 1993. (a) Bottom water-soluble phosphate. (b) Surface TP. Aberrant peaks after HOS were due to minimal, late-season only use of HOS (1995) and an electrical problem (1997) when brief anoxia occurred.
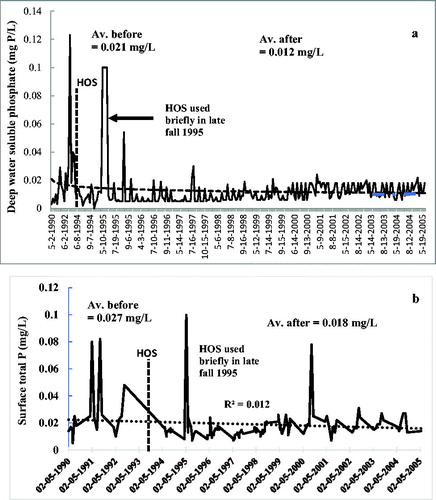
Figure 4. Ammonium in Camanche Reservoir before and after HOS, which began July 1993: (a) bottom water and (b) surface water.
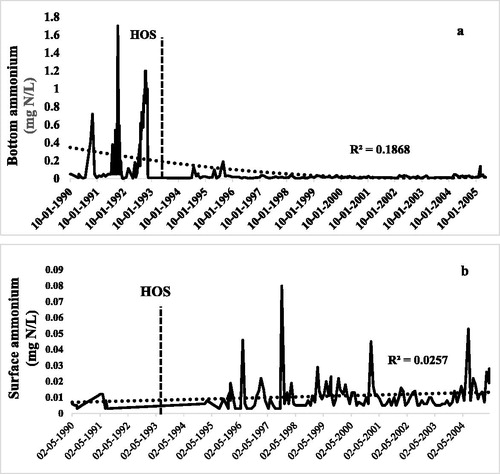
Figure 5. Nitrate in surface water for Camanche Reservoir before and after HOS, which began July 1993.
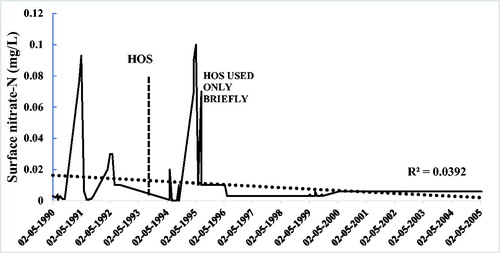
Table 5. Changes in dominant phytoplankton and zooplankton including colonial cyanobacteria before and after HOS which began in late July 1993.
Figure 6. Zooplankton in near-surface water of Camanche Reservoir before (1988–1992) and after (1994–2004) HOS, which began in July 1993. Grand annual means were rotifers 29/L (before) and 50/L (after); crustaceans 9/L (before) and 12/L (after) HOS. Incomplete or no data are available for 1994 and 1996–1998.
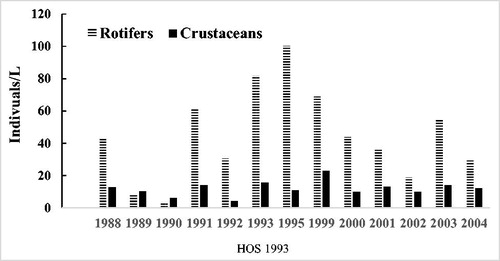
Table 6. Delineation of trophic state based on 4 commonly measured variables, 2 direct (algae and water clarity) and 2 indirect (nutrients). The table is based on literature surveys summarized in Horne (Citation1996) and Cooke and Welch (Citation2008)
