
Figures & data
Table 1. Waterbody and oxygenation system characteristics for Spring Hollow Reservoir, Carvins Cove Reservoir, and North Twin Lake
Figure 1. Summary of HOS operation and hypolimnion dissolved oxygen (DO) in Spring Hollow Reservoir (SHR). Solid black round symbols represent volume-weighted hypolimnetic DO. Black lines represent oxygen addition to the hypolimnion each year, and diamonds represent total annual oxygen added to the hypolimnion. Triangles represent volume-weighted, annual average hypolimnetic DO.
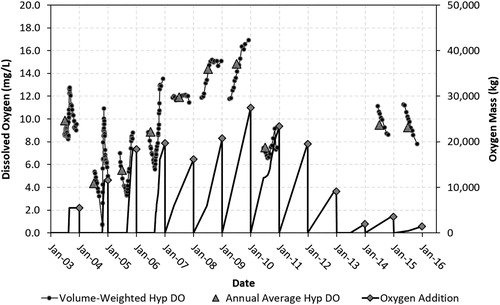
Figure 2. Summary of hypolimnion dissolved oxygen (DO) depletion (HOD) rates in Spring Hollow Reservoir. Black line represents system upgrade from operating with compressed air to pure oxygen. Open triangles represent years when no HOD management was applied. Circled triangle in 2003 indicates aeration and oxygenation operation.
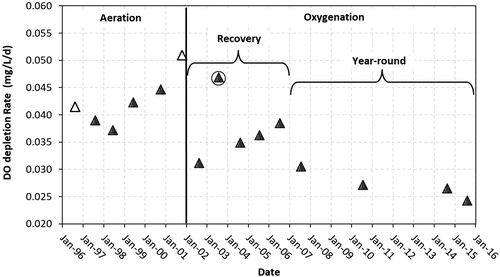
Figure 3. Box plot of HOD data for the 3 different periods of HOS operation in Spring Hollow Reservoir, where aeration corresponds to compressed air use, recovery corresponds to HOS operation to recover DO, and year-round corresponds to continuous HOS operation making seasonal adjustments to applied oxygen flow rate.
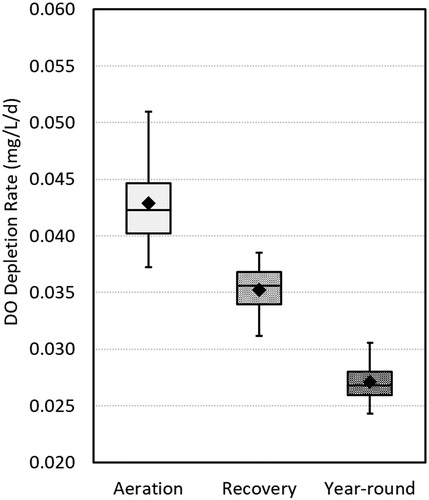
Figure 4. Summary of HOS operation and hypolimnion dissolved oxygen (DO) in Carvins Cove Reservoir. Solid black round symbols represent volume-weighted hypolimnetic DO based on depth profiles. Gray round symbols represent discrete samples of withdrawals from the hypolimnion. Black lines represent oxygen addition to the hypolimnion each year, and diamonds represent total oxygen added to the hypolimnion each year. Triangles represent volume-weighted, annual average hypolimnetic DO.
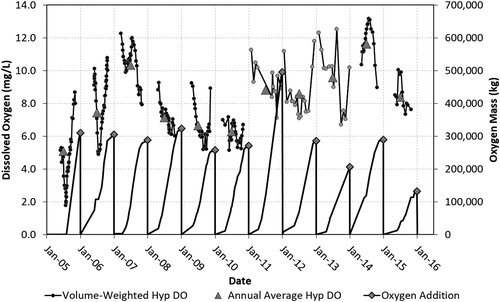
Figure 5. Summary of HOS operation and hypolimnion dissolved oxygen (DO) in North Twin Lake. Solid black round symbols represent volume-weighted hypolimnetic DO based on depth profiles. Gray round symbols represent data collected using remotely deployed sensors. Black lines represent oxygen addition to the hypolimnion each year, and diamonds represent total annual oxygen added to the hypolimnion. Triangles represent volume-weighted, annual average hypolimnetic DO.
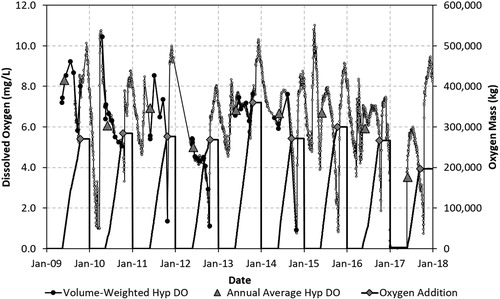
Figure 6. Summary of annual average hypolimnetic dissolved oxygen (DO) versus volume-weighted hypolimnetic DO at HOS startup.
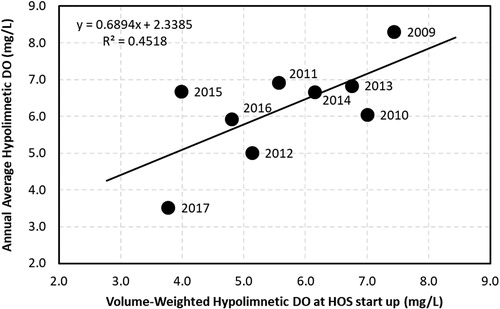
Figure 7. Summary of dissolved oxygen (DO) depletion rates calculated from individual sensors positioned 1.5, 3.0, and 4.0 m above the sediment during winter and spring periods in North Twin Like from 2010 to 2018. The “1.5 (winter)” symbol sizes represent approximately 60, 80, and 120 days, which corresponds to the time period when the depletion rates were analyzed, which typically started in December. Data show a decreased DO demand for the winter sensor 1.5 m above the bottom, with spring rates showing dependence on winter rates. No discernable change is shown for winter sensors 3.0 and 4.0 m above the bottom.
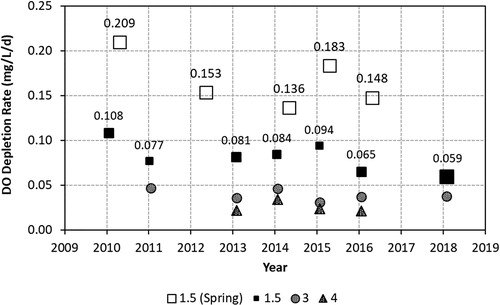
Figure 8. An example of remote dissolved oxygen (DO) data collected in North Twin Lake throughout 2014 for the lower 7 sensors. Seasonal changes are identified, which correspond with the data, showing uniform conditions between fall and ice cover, differing depletion rates during ice cover, water column mixing during spring and fall, uniform depletion during stratification, and DO increase during HOS operation.
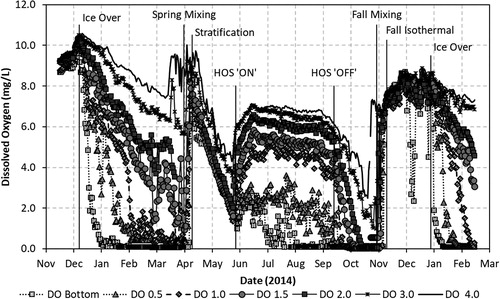
Figure 9. Summarized dissolved oxygen (DO) depletion rates calculated for remote DO sensors placed throughout the water column during 2013–2014, 2014–2015, and 2015–2016 winter periods and 2014 and 2015 initial spring stratification. Data show decreased rates with increasing distance from the bottom during winter and more uniform rates during spring.
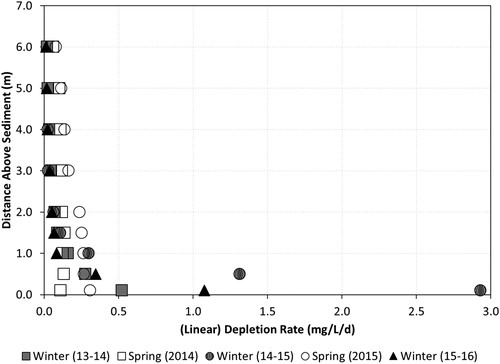
Table 2. Summary table of DO depletion rates for fixed elevation sensors deployed in North Twin Lake
Figure 10. Summary of hypolimnion dissolved oxygen depletion rates in NTL (top) and CCR (bottom). Data from both waterbodies show an increase of approximately 0.002 mg/L/d2 throughout the stratified period.
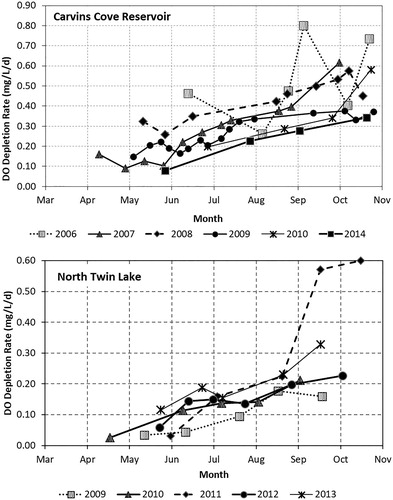
Table 3. Summary table of HOD rates throughout the stratified season in Carvins Cove Reservoir and North Twin Lake