
Figures & data
Figure 1. Views of the subject system. (a) Camanche Reservoir aerial view. Triangle is site of Speece cone close to the dam. Stars are main index sampling stations. Rectangle is site of fish hatchery below dam. (b) View from lower end of reservoir in autumn at normal elevation; white buoys show location of submerged Speece cone. Oxygen and electricity supply pipes are small black lines on far shore and the evaporator is the white structure at far side of dam. (c) Mokelumne River and Fish Hatchery directly below Camanche Reservoir dam.
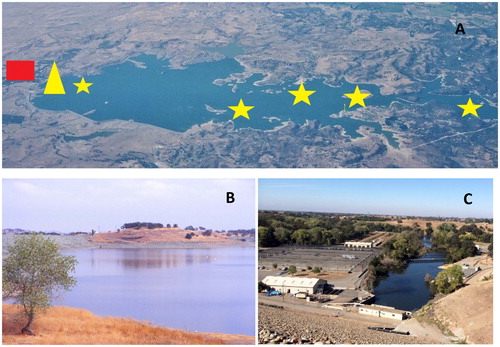
Figure 2. Diagram of the Speece cone installed at the bottom of Camanche Reservoir near the dam. Poor-quality, low-DO water is pumped from 5 m above the sediments into the top of the cone, where it mixes with rising pure oxygen bubbles, dissolves them, and then is released as a highly oxygenated blanket over the sediments (from Brown and Caldwell Citation1995).
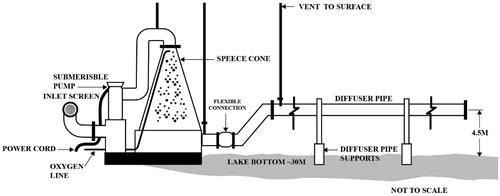
Figure 3. Relationship of redox potential in bottom hypolimnion water (dashes) and sulfide odor (solid line) in water samples collected at the same depth and station. Sulfide odor is shown in arbitrary units as absent (0), mild (100), and strong (200).
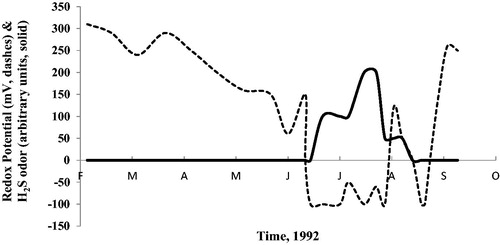
Table 1. Review of possible causes for observed fish kills in the hatchery downstream of Camanche Reservoir.
Figure 4. Time course of the autumn 1989 steelhead trout fish kills. Most deaths occurred in 18 d starting 1 October. Fearing a repeat of the 1987 deaths, all the young Chinook salmon had been planted by 25 Sep 1989. Permanganate addition to oxidize H2S was begun on 13 Oct. Based on Miyamoto (Citation1989).
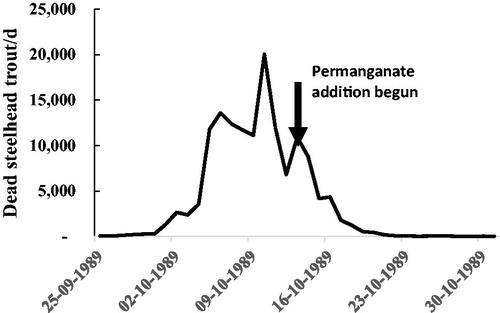
Figure 5. Time course of selected variables during the autumn 1989 steelhead trout deaths. Daily die-offs (solid bar) peaked on 10 Oct, while most other variables did not change much. DO supplied from reservoir hypolimnion (dotted line) was always low in DO but always high in DO at the head of hatchery after aeration (diagonally cross-hatched line). Temperature (pattern) and pH (circles) remained similar and suitable for salmonids. Turbidity (horizontal hatching) did increase before the start of the deaths. H2S was not measured but odors were detected during the fish kills. Based on Miyamoto (Citation1989).
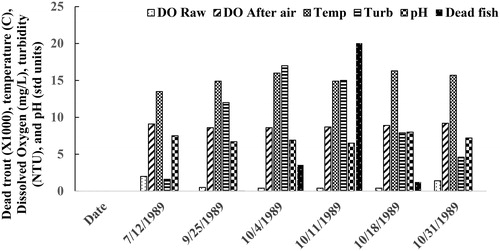
Figure 6. Redox depth profile for a typical summer before (squares on dashed line) and after (dots on solid line) use of a hypolimnetic oxygenation system (HOS).
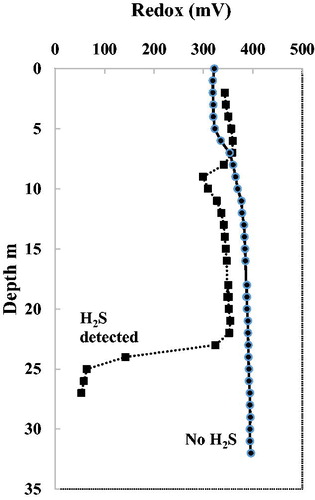
Figure 7. Distribution of fish (arbitrary units [triangles on dotted line]) in Camanche Reservoir with depth (a, 1992) before and (b, 1993) after HOS operation. Fish formerly squeezed around the thermocline moved throughout the entire water column after HOS operation. Also shown are DO (mg/L [squares on solid line]) and temperature (C [dots on dashed line]). Fish numbers are counts from the echo-sound reflection.
![Figure 7. Distribution of fish (arbitrary units [triangles on dotted line]) in Camanche Reservoir with depth (a, 1992) before and (b, 1993) after HOS operation. Fish formerly squeezed around the thermocline moved throughout the entire water column after HOS operation. Also shown are DO (mg/L [squares on solid line]) and temperature (C [dots on dashed line]). Fish numbers are counts from the echo-sound reflection.](/cms/asset/c89314dc-e5b0-4f7a-8a2d-9a3822eea7ed/ulrm_a_1649770_f0007_b.jpg)
Figure 8. Seventy-three years of fall-run Chinook salmon returns (1944–2017) showing immediate increases due to HOS operation in 1993 and later improvements made possible by oxygenation. Also shown are droughts (triangles of varying width) and averages before and after HOS (dash-dot lines). Source: EBMUD and California Department of Fish & Wildlife continuous monitoring at the hatchery and fish counting facility at the downstream Woodbridge Irrigation District’s Dam.
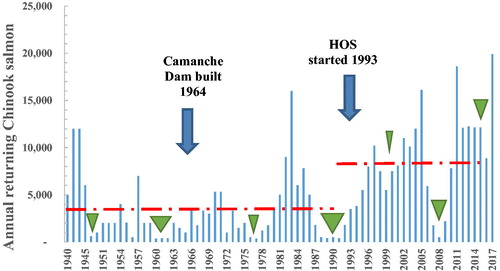
Table 2. Chinook salmon returns in the Mokelumne River for various periods of time.
Table 3. Chinook salmon returns in the Mokelumne River during drought years before and after operation of a hypolimnetic oxygenation system (HOS).
Table 4. Comparison of hypolimnion volume decline in Camanche Reservoir between 2 yr representing drought (1987) and nondrought (1986) conditions.