Figures & data
Figure 1. (A) Location of Manitoulin Island, Lake Manitou (denoted by the black circle), and the Gore Bay climate station (denoted by the white circle) in Ontario, Canada. (B) Major land-use types within the Lake Manitou watershed. Stars indicate coring locations within the east and west basins.
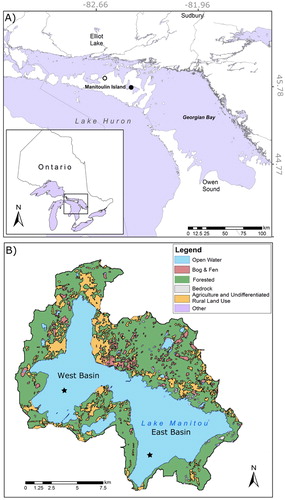
Table 1. Water chemistry data collected from Lake Manitou’s east basin in June of 2015 and the west basin in August of 2016. Samples were collected from approximately 2 times the Secchi depth (east basin Secchi = 4.8 m; west basin Secchi = 7.2 m) and were analyzed by the Ontario Ministry of the Environment, Conservation and Parks laboratory at the Dorset Environmental Science Centre.
Figure 2. Mean annual air temperature (MAAT) from the Gore Bay climate station located ∼30 km from Lake Manitou. Linear regression was applied to the temperature data and the equation of the linear fit as well as the total increase over the monitoring record are noted. Air temperature data were acquired from Environment and Climate Change Canada and have been adjusted and homogenized to account for procedural and instrument changes over the monitoring record.
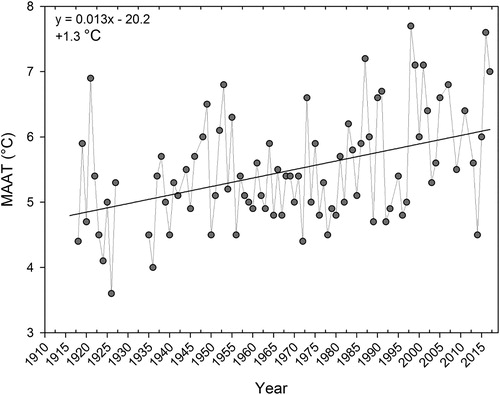
Figure 3. Secchi depth measurements (left) for the east and west basins of Lake Manitou from 1994–2017. Secchi depth measures were collected once or twice a month and averaged over each year. Total phosphorus (TP) measurements (right) from the east and west basin collected monthly during May to October from 2002 to 2017. These data were collected through the Ontario Lake Partner Program with analysis for TP conducted on composite water samples collected from the Secchi depth.
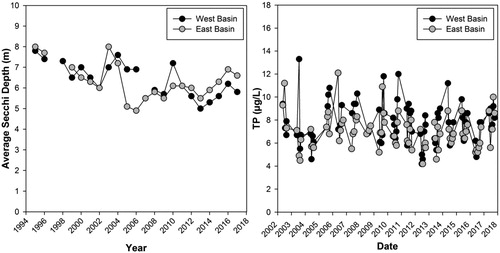
Figure 4. Downcore percent relative abundance data for diatom and chironomid taxa that occurred in >5% in at least 2 intervals in the sediment cores from the east basin (A) and the west basin (B). Diatoms and chironomid data are plotted against core depth (interval midpoint) and 210Pb date generated using a constant rate of supply (CRS) model. For the east basin, dates earlier than ∼1936 have been extrapolated, and for the west basin, dates earlier than ∼1870 have been extrapolated; extrapolated dates should be viewed with caution and are noted with an asterisk (*). Date extrapolations for both cores were performed using a second-order polynomial. To help visualize trends, species were grouped into complexes if they had similar ecological characteristics and experienced similar trends through time. The number of taxa within each complex is noted in the brackets that follow each taxonomic grouping. For both basins, the small cyclotelloid complex included Lindavia comensis, L. gordonensis, L. michiganiana, L. ocellata, L. radiosa, Cyclotella cyclopuncta, C. tripartita, and Discostella stelligera. The benthic fragilarioid complex included Staurosirella pinnata, Staurosira construens, and Pseudostaurosira brevistriata. In the east basin, the Stephanodiscus complex included Stephanodiscus medius, S. niagarae, and S. minutulus. Horizontal gray lines divide important groupings within the downcore assemblage data that were identified by CONISS and broken stick analyses.
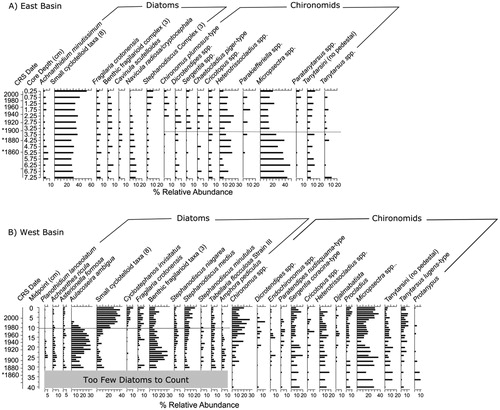
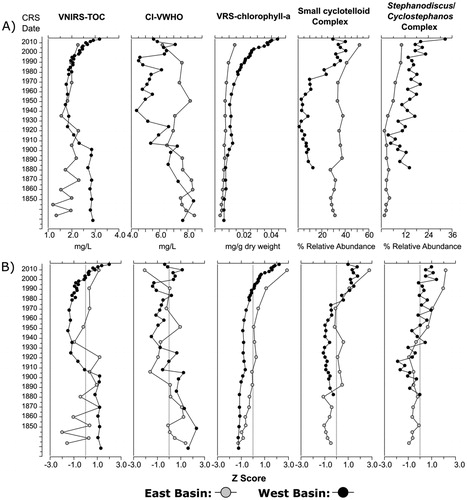
Figure 5. (A) Trends in visible–near-infrared spectroscopy (VNIRS) inferred lakewater total organic carbon (TOC) concentrations, chironomid-inferred volume-weighted hypolimnetic oxygen (CI-VWHO) concentration, visible range spectroscopy (VRS) inferred sedimentary chlorophyll a (and its main diagenetic products) concentrations, percent relative abundance of small cyclotelloid taxa (including Lindavia comensis, L. gordonensis, L. michiganiana, L. ocellata, L. radiosa, Cyclotella cyclopuncta, C. tripartita, and Discostella stelligera), and percent relative abundance of Cyclostephanos and Stephanodiscus taxa (including S. medius, S. niagarae, and S. minutulus in the east basin and S. medius, S. niagarae, S. minutulus, and C. invisitatus in the west basin). The east basin is depicted in gray circles and the west basin is depicted in black circles. Data have been plotted against the 210Pb dates generated by the constant rate of supply (CRS) model. Dates past background 210Pb activity (1936 in the east basin and 1870 in the west basin) have been extrapolated using second-order polynomials for both basins and should be interpreted with caution. (B) Plots depict the same data standardized using Z-scores to better assess directional trends in each variable. To aid in the visualization of trends, a Z-score value of 0 is marked on each plot by a vertical gray line.