Figures & data
Figure 1. Sediment core station locations in Lake McCarrons, Minnesota.
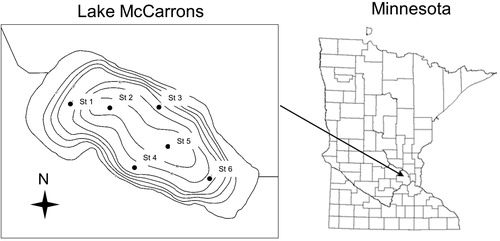
Table 1. Sediment physical-textural characteristics of the upper 5-cm sediment layer at various stations in Lake McCarrons, Minnesota. Station numbers are generally ordered from west to east (i.e., low to high numbers, 1 = west, 6 = east).
Figure 2. Vertical variations in sediment aluminum (Al) concentration measured at various stations in 2016. Vertical dashed lines represent background Al concentrations. Arrows denote the general location of added Al.
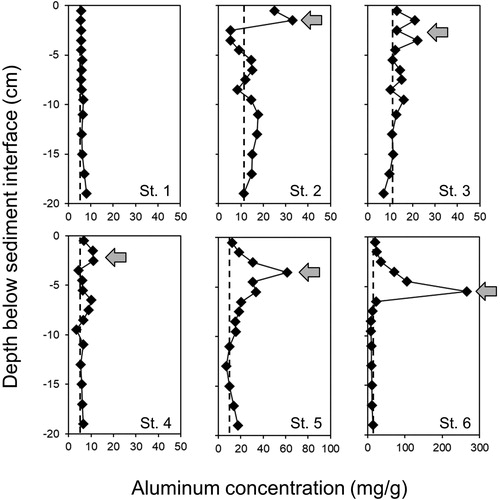
Table 2. Background-corrected concentrations of added aluminum (Al) and adsorbed aluminum-bound phosphorus (Al-bound P) at various stations in Lake McCarrons, Minnesota. Station numbers are generally ordered from west to east (i.e., low to high numbers, 1 = west, 6 = east). Background-corrected concentrations were calculated by subtraction (i.e., concentration-background concentration, see ). ND = not detected. The added Al percentage is based on 77 g/m2 added in 2004.
Figure 3. Vertical variations in sediment moisture content (upper panels), solids content, and wet bulk density (lower panels) for St 2 (left panels), St 5 (middle panels), and St 6 (right panels) in 2016.
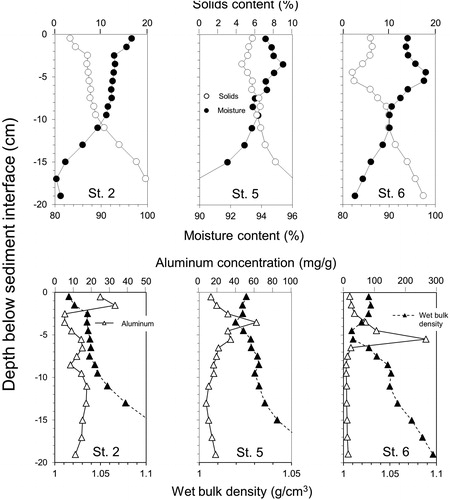
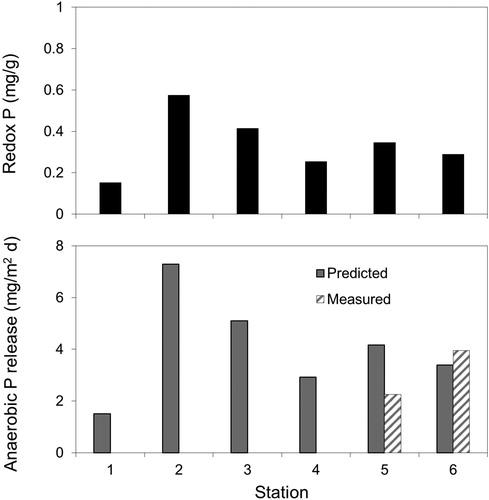
Figure 4. Vertical variations in redox-P (i.e., the sum of the loosely-bound P and iron-bound P fractions) and aluminum-bound P concentrations measured at various stations in 2016.
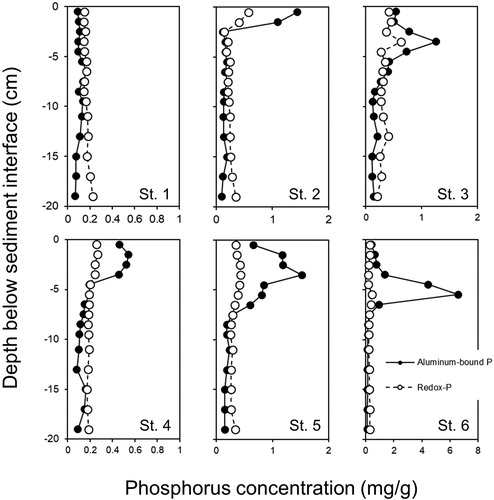
Figure 5. A comparison of relationships between sediment aluminum and aluminum-bound phosphorus (P, upper panels), the molar aluminum:aluminum-bound P (Al:P) binding ratio (middle panels), and the molar P:Al ratio (lower panels) for Lake McCarrons sediments (left) and other lakes (right, Egemose et al. Citation2013, Huser Citation2012, Huser et al. Citation2011, Rydin and Welch Citation1999, Rydin et al. Citation2000).
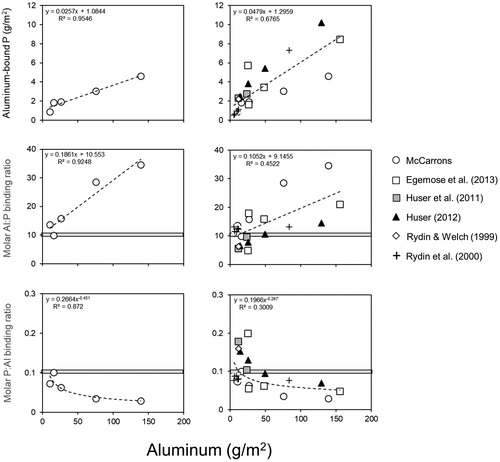
Figure 6. Variations in redox-P (i.e., the sum of the loosely-bound P and iron-bound P fractions) in the surface sediment (upper panels) and predicted (Nürnberg Citation1988) and measured anaerobic diffusive P flux at various stations in Lake McCarrons.