Figures & data
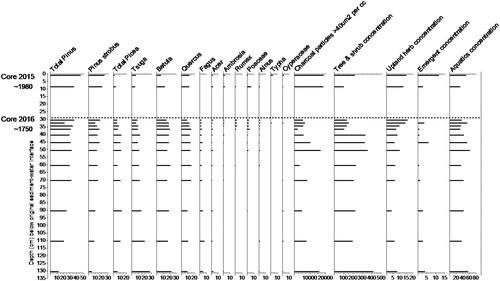
Figure 1. Bathymetry (m), and location of short sediment cores and extractable sediment (Al:Fe) ratio, dam above inlet Basin Stream (northwest) and outlet stream (east) indicated by arrow tips, and Core 2015 and Core 2016. Figure modified from Doolittle et al. (Citation2018).
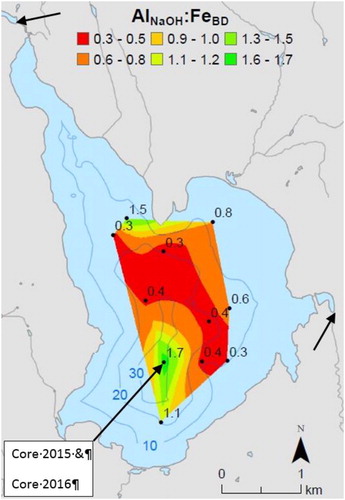
Figure 2. (a) Percent water and (b) percent LOI for Cores 2015 and 2016, from 35 m, from Lake Auburn, Maine. Depth for Core 2016 has been adjusted downward by 30 cm, based on the specific activities of 210Pb and 137Cs (see text).
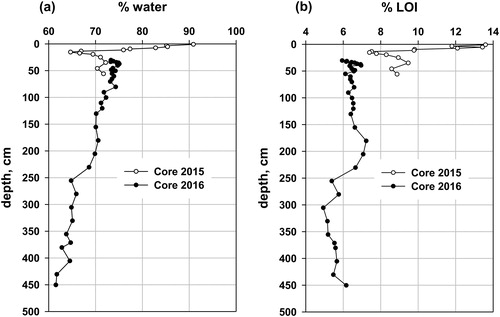
Figure 3. Lake Auburn, Maine: (a) 210Pb specific activity in Cores 2015 and 2016 (Core 2016 adjusted downward by 30 cm). The vertical dashed line represents background 210Pb from decay of 226Ra (radium) in the sediment. (b) 137Cs specific activity in Cores 2015 and 2016 (Core 2016 adjusted downward by 30 cm). Background 137Cs is zero.
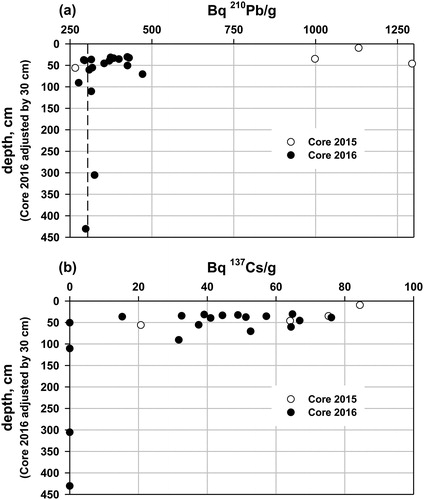
Figure 4. 206Pb:204Pb for Cores 2015 and 2016, from 35 m, from Lake Auburn, Maine. Depth for Core 2016 has been adjusted downward by 30 cm based on the specific activities of 210Pb and 137Cs. One standard deviation for the 206Pb:204Pb ratio is 0.0232 (Core 2015) and 0.0230 (Core 2016), based on multiple analyses of the same sample.
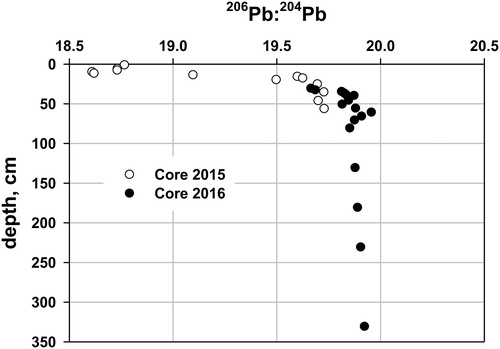
Figure 5. Extractable Al, Fe, P, and Ca (all in µmol/g dry sediment) in 4 Psenner extractions for Lake Auburn, Maine, sediment: 31 and 52 cm from Core 2015, and sediment from 50.5, 60.5, 90.5, 130.5, 230.5, and 355.5 cm from Core 2016 (depths adjusted downward by 30 cm). Dashed line is the demarcation between Core 2015 (above) and Core 2016 (below).
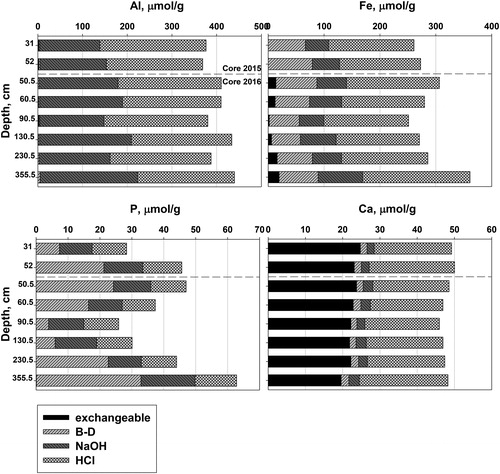
Figure 6. SEM image of sediment from 55 to 57 cm in Core 2015, Lake Auburn, Maine. Arrow points to apatite crystal.
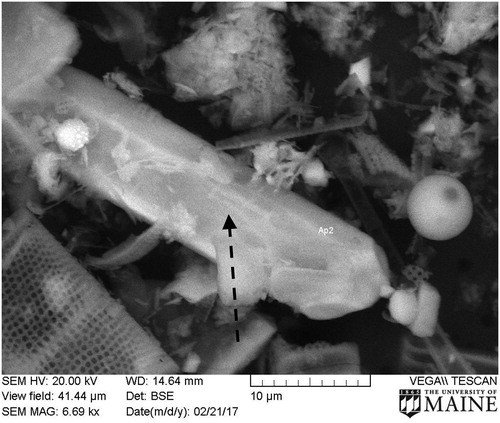
Figure 7. Percent total S and δ34S for Cores 2015 and 2016 from Lake Auburn, Maine. Depths for Core 2016 adjusted downward by 30 cm. Percent S is given as 0.005 for samples below the detection limit of 0.01%.
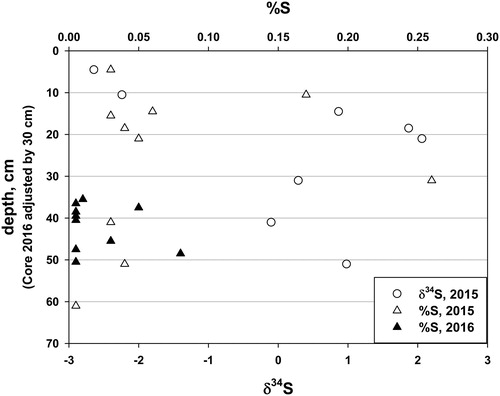
Figure 8. Diatom taxa for Cores 2015 (open circles) and 2016 (filled circles; depths adjusted downward by 30 cm) from Lake Auburn, Maine.
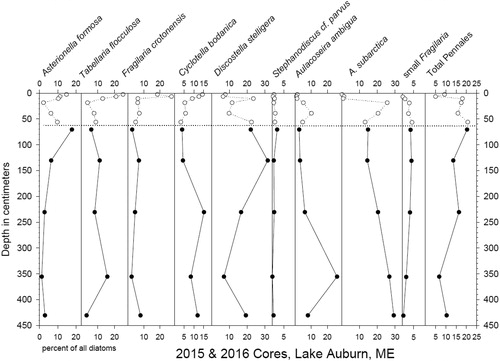
Figure 9. Pollen from Cores 2015 (top) and 2016 (bottom) from Lake Auburn, Maine. Charcoal and pollen concentrations are particles or pollen/cm3 of sediment. X-axis values for columns 16–19 are multiples of 1000. X-axis values for columns 1–14 are percentages of total tree and shrub, upland herb, and emergent pollen. Core depths are in cm below the original sediment/water interface.