Figures & data
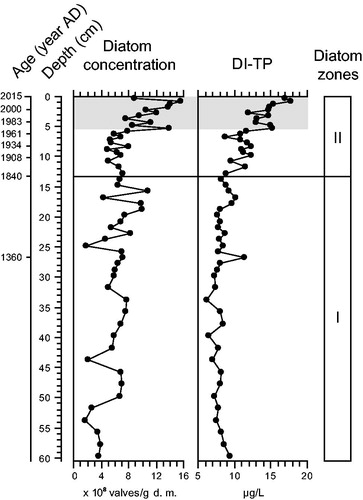
Figure 1. Map of the study area in eastern subarctic Quebec and bathymetric contours (in meters) of the northern basin of Lac Carheil (modified from MRN Citation1977).
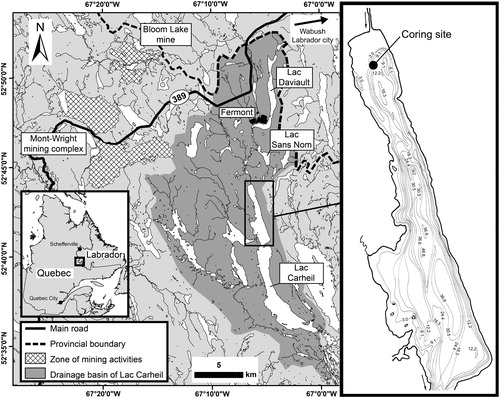
Table 1. Modern and historical limnological data from Lac Carheil’s waters.
Figure 2. Optical photographs of the sediment cores retrieved from the bottom of Lac Carheil with the resulting composite core.
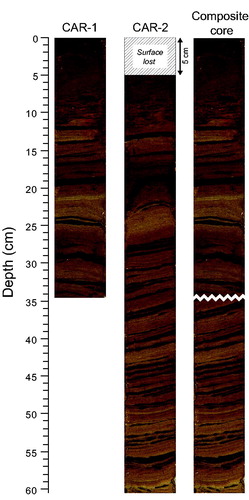
Figure 3. (A) Unsupported 210Pb decay curve and 137Cs activity in the upper part of the composite core (CAR-1; 0–34.5 cm); (B) resulting age–depth curve of the uppermost section (0–12 cm) based on the application of the CRS model; and (C) estimated chronological curve for the entire composite core (CAR-1 + CAR-2; 0–60.5 cm) based on 210Pb and 14C dating.
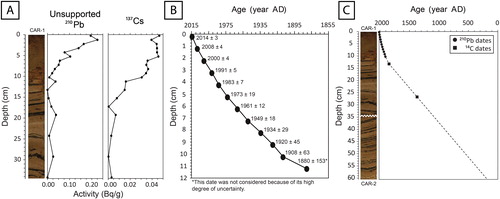
Table 2. Samples dated using 14C AMS in the composite core with their respective radiocarbon and calendar ages.
Figure 4. Microradiographs (radio) and relative concentration stratigraphic profiles of the selected elements obtained from the μ-XRF analyses. The gray shaded area corresponds to the period of modern settlement in the catchment (i.e., 1971–2015).
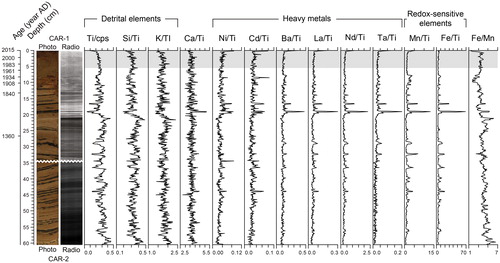
Figure 5. Stratigraphic variation profiles of water (% water), organic matter (% OM), carbon (% C) and nitrogen (% N) concentrations, carbon to nitrogen ratio (C/N), and mean grain size within the composite core. The gray shaded area corresponds to the period of modern settlement in the catchment (i.e., 1971–2015).
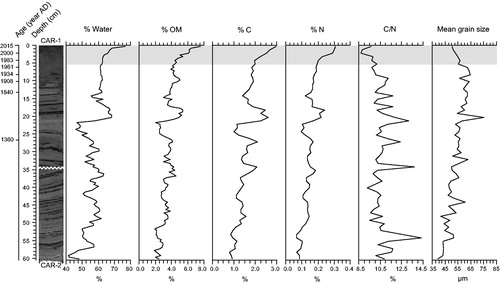
Figure 6. Stratigraphic relative abundance variation profiles of the most common diatoms (≥2.5% in at least one level, except for Stephanodiscus minutulus) preserved in the composite core along with the profile of the PCA axis 1 sample scores summarizing the stratigraphic variations in the composition of the whole diatom assemblages. The black line (1840 AD) delimits the 2 statistically distinct diatom zones, whereas the gray shaded area marks the period of modern settlement in the catchment (i.e., 1971–2015). Note. The Staurosirella pinnata complex includes S. pinnata (mainly), S. pinnata var. acuminata, and S. pinnata var. intercedens; the Pseudostaurosira brevistriata complex includes P. brevistriata (mainly), P. brevistriata var. papillosa, and P. brevistriata var. elliptica; and the Achnanthidium minutissimum complex includes capitate and noncapitate forms of A. minutissimum.
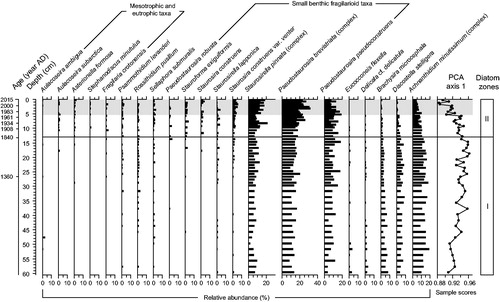
Figure 7. Stratigraphic variation profiles of the diatom absolute concentration and diatom-inferred total phosphorus (DI-TP) concentrations in the composite core. The black line (1840 AD) delimits the 2 statistically distinct diatom zones, whereas the gray shaded area marks the period of modern settlement in the catchment (i.e., 1971–2015).