
Figures & data
Figure 1. (a) Mokelumne River fish hatchery: aerial shot from below the dam showing location of the Speece cone on the reservoir bed 180 m from the dam (depth ∼30 m) as well as the reservoir. (b) Diagram of the large Speece cone hypolimnetic oxygenation system used to deliver up to 8 tonnes/d of pure oxygen to the bottom waters of Camanche Reservoir.
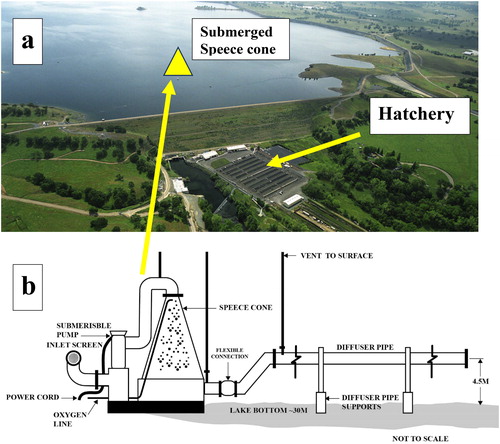
Figure 2. (a) Map of the 12 km long reservoir showing shallow water (<15 m, dark gray) and the deeper parts and thalweg (light gray). Oxygenation is confined to the deeper area. The approximate location of the Speece cone and dam are shown in heavy black. (b) Map of area of cone and dam in Camanche Reservoir showing turbidity stations T-1 to T-3 (circles with X) used for local effects of the plume. The Speece cone (hatched) was located between T-1 and T-2. The hatchery (diamond) is just below the dam.
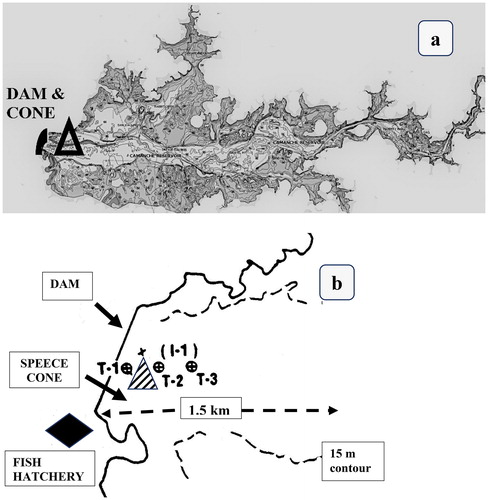
Figure 3. In-reservoir spatial variation in turbidity in bottom 8 m of the water column (i.e., within oxygenated plume) near and distant from the HOS manifold at 5 stations from 16 June–5 Nov 1993, the first year of operation. Hatched bars = HOS on, plain bars = HOS off. Up-reservoir turbidity increases (1.4–1.9 NTU) occurred near the Speece cone. Down-reservoir was unaffected by plume but was homogenized by the cone’s inlet sucking.
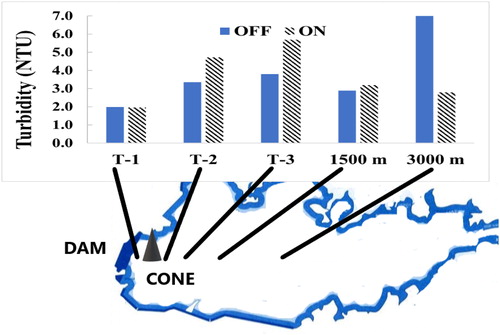
Table 1. Listing of periods of oxygenation and amount added in 1993–1994 during the on/off tests.
Figure 4. In-reservoir turbidity depth profiles for bottom 8 m of water at the 5 stations shown in and 3 from 16 Jun to 5 Nov 1993, the first year of operation of HOS. Hatched = HOS on, plain bars = HOS off. (a–d) Stations within plume showing increased turbidity with HOS on and declining turbidity when off. Effect was greater near the cone, fading away between 1.5 and 3 km down-reservoir. (e) Site T-1 out of the plume with inversion of normal increase in turbidity with depth, probably caused by the sucking effect of the cone inlet pump.
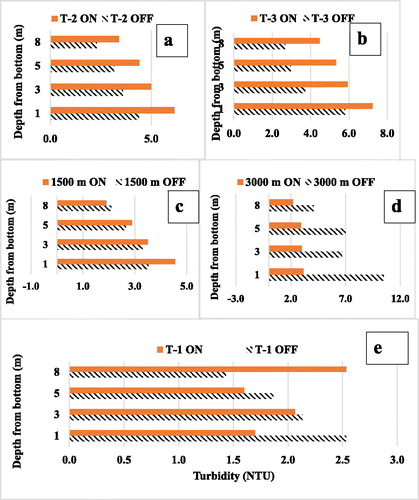
Figure 5. Hatchery turbidity. (a) Startup year (1993 dashed line, squares) and pre-HOS (1992, solid line, crosses). (b) After 2 years of HOS operation (1994, dashed line, squares) and pre-HOS (1992, solid line, crosses). (c) Minimal HOS use in late Oct only (1995 dashed line, squares) and pre-HOS (solid line, crosses).). One season of HOS was required to reduce overall turbidity with the main effect in spring–summer. The autumn increase in turbidity in the startup year was eliminated in the second year (1994) but returned in 1995 when HOS was not used (anoxia occurred and nutrient increased; Horne and Beutel Citation2019).
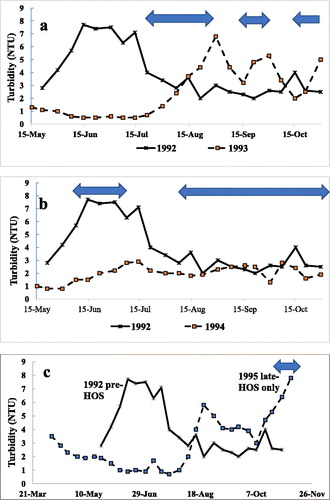
Figure 6. Hatchery. Short-term trends in turbidity in the fish hatchery inflow: a week in summer 1991 (2 years before HOS; solid line) and much lower values for the same summer week in second year of HOS in 1994 (dashed line, n = 26).
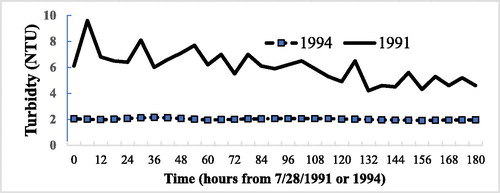
Table 2a. Decline in turbidity after HOS during the thermally stratified period, Average in bottom 8 m of the reservoir close to tailwater outlet 1991–1995 and in the fish hatchery or river, both fed by tailwaters (1991–2009).
Table 2b. Decline in turbidity after HOS during the thermally stratified period, Peak at hatchery 1991–1994.
Figure 7. Hatchery. Periodicity in turbidity ( = 11.9 hrs.) and longer-term decline in turbidity in the hatchery supply over one week in summer before installation of HOS (R2 = 0.6, n = 125), showing considerable inherent variations.
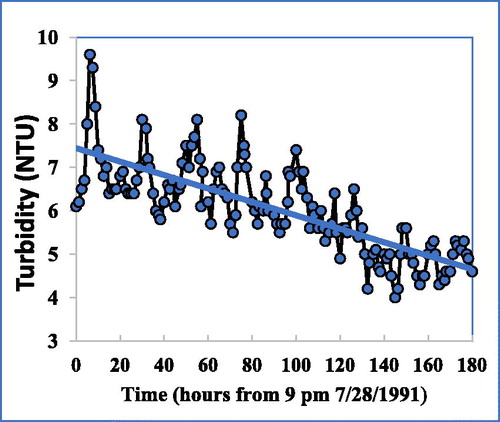
Figure 8. Hatchery. Variation in turbidity and water clarity (Secchi depth) for May–October 1994, the first full year of operation.
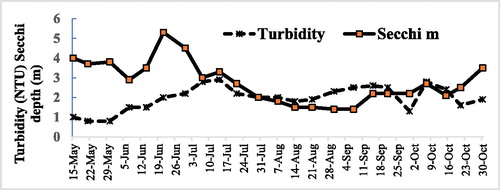
Figure 9. Hatchery. Regression of Secchi disk depth (algae blooms) and surface water turbidity between May and Oct 1994 lagged by 4 weeks (to allow the algae to die and sink to the bottom, R2 = 0.57, n = 43, p = 0.002926).
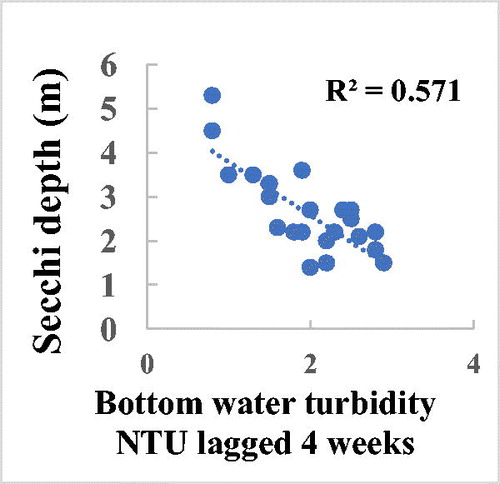
Figure 10. Particle size spectrum showing similarity in neritic layer particles from 2 sites in Camanche Reservoir. There were few particles above 80 µm except for those that had accumulated in the egg trays.
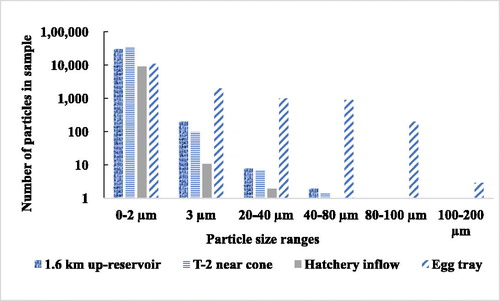
Figure 11. Percent elemental composition of Camanche Reservoir neritic zone particles showing the 8 most common elements during HOS operation. The egg tray sediments (far left bars) bear little resemblance to the suspended matter from the hatchery inflow (second from left), or the deep-water matter either at the site near the Speece cone (third from left) or from a central reservoir site (far right bar). Hatch = fish hatchery.
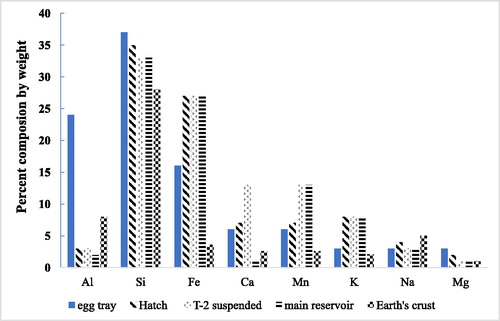
Table 3. Chemical analysis (in ppm) of organic matter and silica in neritic zone particles from the fish hatchery, suspended sediments from the influent to the hatchery, and deep water of Camanche Reservoir in November 1993 during oxygenation. TSS = total suspended solids, VSS = volatile suspended solids (organic matter).
Table 4. Algae (cells/L) in sediments from the fish hatchery and neritic zone particles from the deep-water hypolimnion of Camanche Reservoir on 1 Jun 1994.