Figures & data
Figure 1. Study site locations. Map showing the location of Lac de Gras within the Northwest Territories of Canada (inset A), and the locations of the Diavik Diamond Mine and the 3 sediment coring locations within Lac de Gras (inset B). Yellow stars represent the locations of major population centers in the Northwest Territories, including the city of Yellowknife (northernmost star).
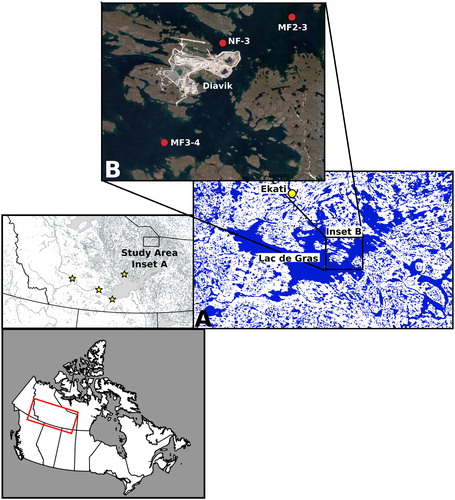
Table 1. Lac de Gras sediment coring sites.
Figure 2. Results of 210Pb gamma dating of Lac de Gras cores. Radioisotopic activities for 210Pb, 214Pb, and 137Cs in sediment cores collected from 3 sites (NF3, MF2–3, MF3–4) in Lac de Gras. Chronology and inferred sedimentation rates were determined using the constant flux constant sedimentation model (Appleby and Oldfield Citation1978).
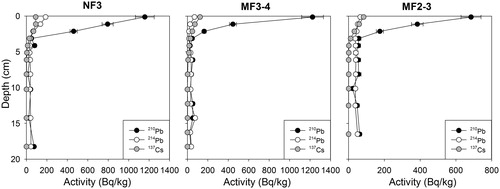
Figure 3. Temporal trends in sedimentary metal concentrations in Lac de Gras sediment cores. Stratigraphy showing downcore changes in several metals at 3 sites in Lac de Gras along a gradient of impact from diamond mining operations. Concentrations are in µg/g dry weight. The gray box represents the current mining period.
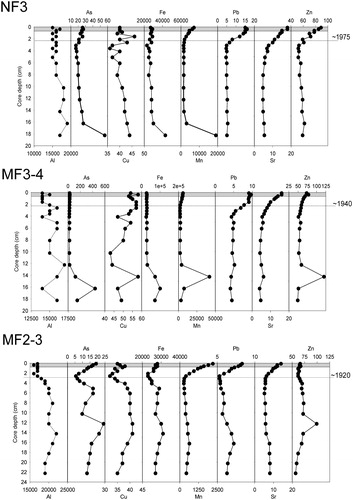
Figure 4. Temporal changes in organic matter composition in Lac de Gras cores. Stratigraphy showing downcore changes in nitrogen stable isotope composition, percent total nitrogen (TN), percent total organic carbon (OC), percent sulfur (S), carbon:nitrogen ratio (C/N), and chlorophyll a inferred using visible reflectance spectroscopy (mg/g dry weight) in sediment cores from Lac de Gras along a gradient of impact from diamond mining operations. The gray box represents the current mining period. The dashed line represents the estimated lower method detection limit for VRS–chlorophyll a (Michelutti et al. Citation2005).
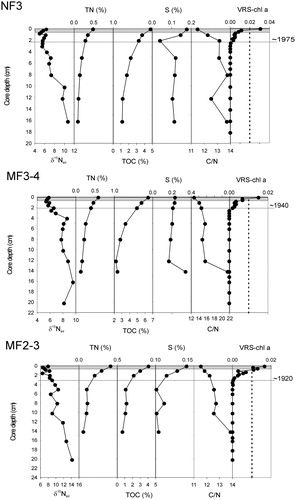
Table 2. Rates of change in geochemical proxies in Lac de Gras sediment cores.
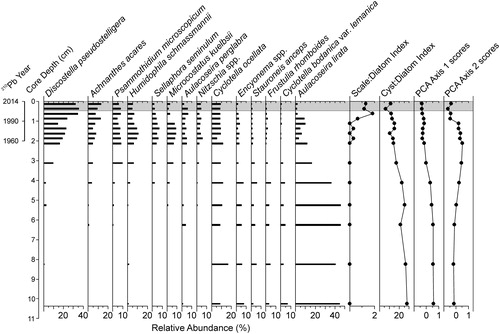
Figure 5. Temporal changes in diatoms at site NF3. Stratigraphic profile of the most abundant diatom taxa (as relative abundances) in a sediment core collected from site NF3 in Lac de Gras, located near the effluent discharge site at the Diavik Diamond Mine. 210Pb-inferred dates are shown as a secondary y-axis. Principal components analysis axis 1 and axis 2 scores for diatom assemblages are also shown, as well as the ratio of chrysophyte scales to diatoms, and the ratio of chrysophyte cysts to diatoms. The gray box represents the current mining period.
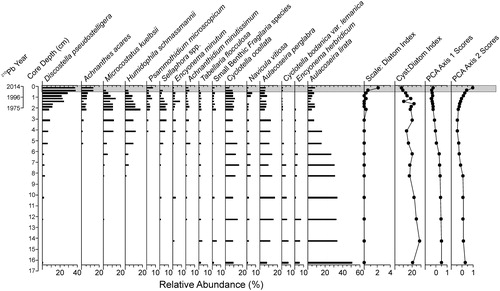
Figure 6. Temporal changes in diatoms at site MF2–3. Stratigraphic profile of the most abundant diatom taxa (as relative abundances) in a sediment core collected from site MF2–3 in Lac de Gras, located midfield from the Diavik Diamond Mine. 210Pb-inferred dates are shown as a secondary y-axis. Principal components analysis axis 1 and axis 2 scores for diatom assemblages are also shown, as well as the ratio of chrysophyte scales to diatoms, and the ratio of chrysophyte cysts to diatoms. The gray box represents the current mining period.