Figures & data
Figure 1. Location of the 6 study lakes in the Upper Kissimmee Basin. Modified from a map prepared by Kissimmee Division, Ecosystem Restoration Department, South Florida Water Management District (Citation2005).
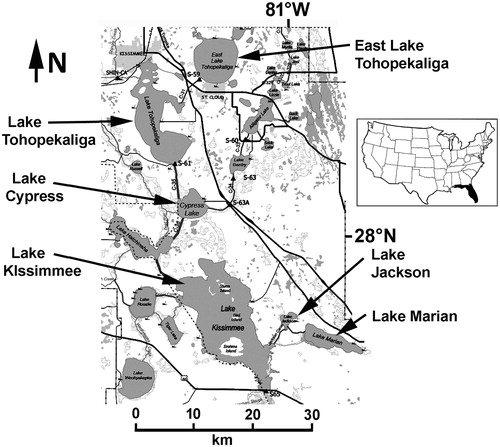
Table 1. Coring locations and modern mean water quality for study lakes.
Figure 2. Diatom profile with CONISS zonation for core 29_XII_2017_CYP_3 from Lake Cypress. Lower panels show sedimented algal and cyanobacterial pigment profiles from Lake Cypress core 18_XI_2016_CYP_40.
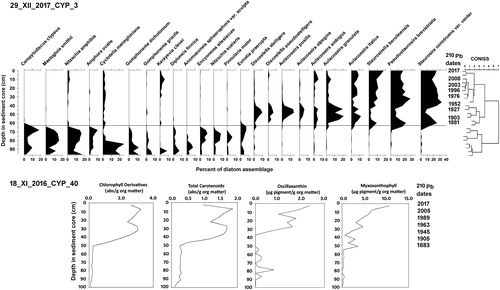
Figure 3. Plots of δ13C versus C/N ratios in sedimented organic matter for cores from Lakes Cypress, East Tohopekaliga, Jackson, and Tohopekaliga, the 4 lakes that showed prominent changes in primary producer communities over time. Specific taxa are placed in relative positions based on δ13C and C/N values reported for studies of other Florida lakes, and are used here to provide general indication of trends in community change.
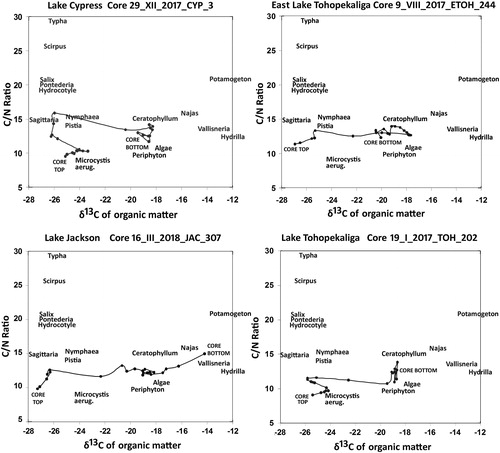
Figure 4. Diatom profile with CONISS zonation for core 9_VIII_2017_ETOH_244 from East Lake Tohopekaliga. Lower panels show sedimented algal and cyanobacterial pigment profiles.
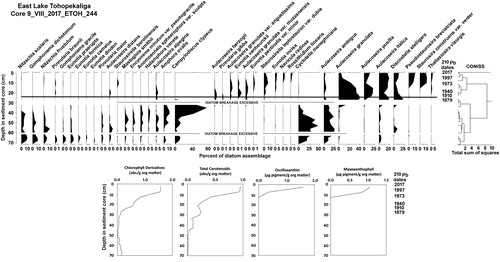
Figure 5. Diatom profile for core 16_III_2018_ JAC _307 from Lake Jackson. Lower panels show sedimented algal and cyanobacterial pigment profiles. CONISS was not performed because of the broad gaps in diatom presence.
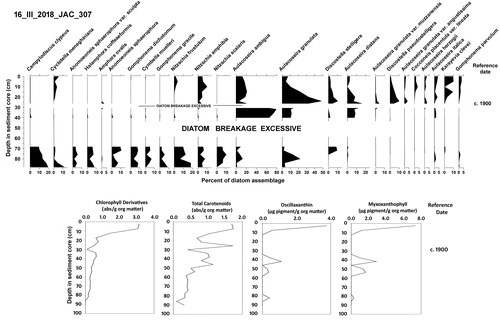
Figure 6. Diatom profile with CONISS zonation for core 19_I_2017_TOH_202 from Lake Tohopekaliga. Lower panels show sedimented algal and cyanobacterial pigment profiles.
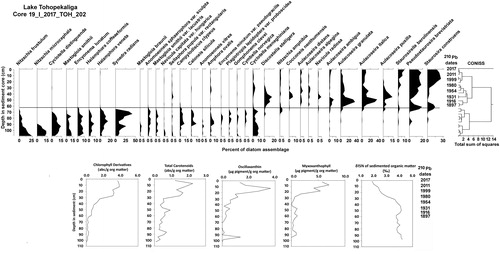
Figure 7. Diatom profile with CONISS zonation for core 27_XII_2017_KIS_2 from Lake Kissimmee. Lower panels show sedimented algal and cyanobacterial pigment profiles. Lower right panel presents diatom-based limnetic total P inferences.
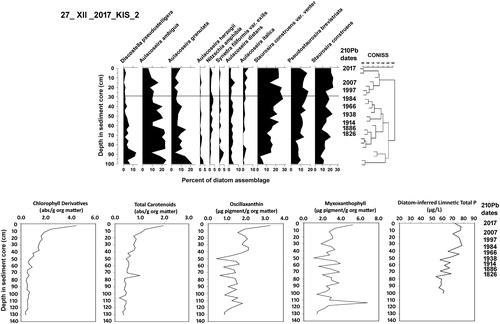
Figure 8. Plots of δ13C versus C/N ratios in sedimented organic matter for cores from Lakes Kissimmee and Marian from the early 1800s until 2017. Both lakes lacked macrofossil evidence and were consistently dominated by algae and cyanobacteria over time. Specific taxa are placed in relative positions based on δ13C and C/N values reported for studies of other Florida lakes, and are used here to provide general indication of trends in community change.
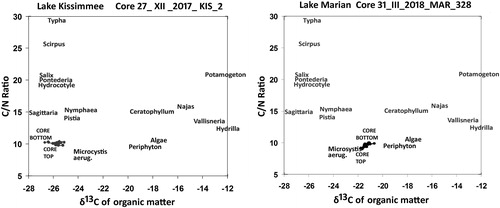
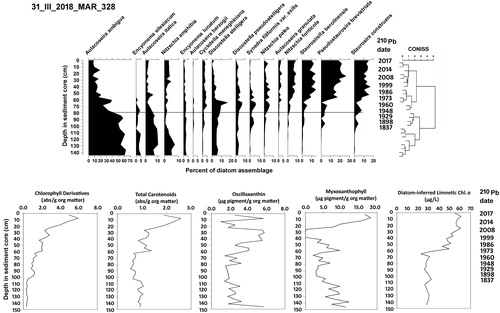
Figure 9. Diatom profile with CONISS zonation for core 31_III_2018_MAR_328 from Lake Marian. Lower panels show sedimented algal and cyanobacterial pigment profiles. Lower right panel presents diatom-based limnetic chlorophyll a inferences.