
Figures & data
Figure 1. The locations of the study areas: (a) the location of the study area in Iran and Khuzestan province, (b) elevations overlooking the lake (m), and (c) the locations of Hosseinieh and Safi Abad synoptic stations in relation to Dez Dam Lake.
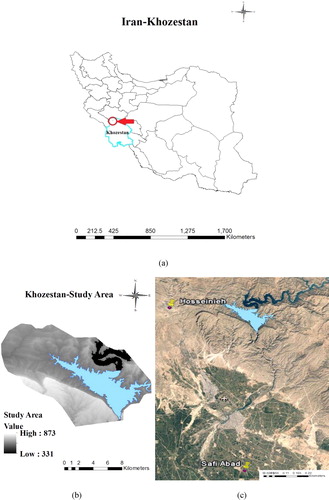
Figure 2. Schematic view of the wind shelter situation, with 3 points (1, 2, and 3) based on a linear profile from a hypothetical topography (Winstral et al. Citation2002, Farokhzadeh et al. Citation2014).
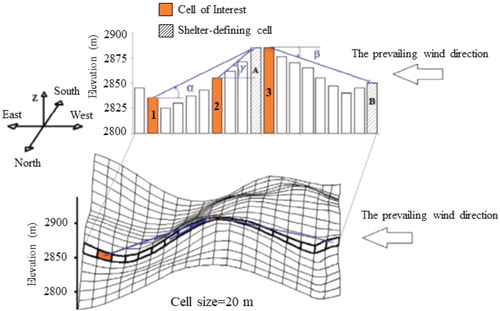
Figure 3. Raster maps of Sx values for an effective length of 1000 m for (a) Jun, (b) Jul, (c) Aug, and (d) Sep.
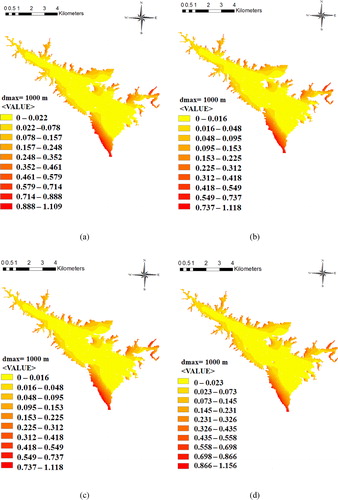
Figure 4. June wind roses at 2 synoptic stations: (a) Hosseinieh and (b) Safi Abad, from 2005 to 2016.
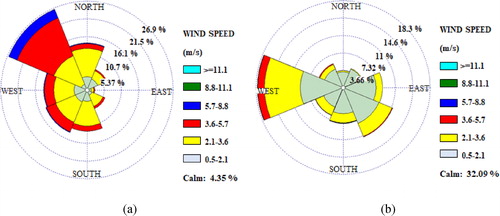
Figure 5. Impact bounds of wind direction with azimuth 262.5 to 322.5º (13 directions), for one of the grid points.
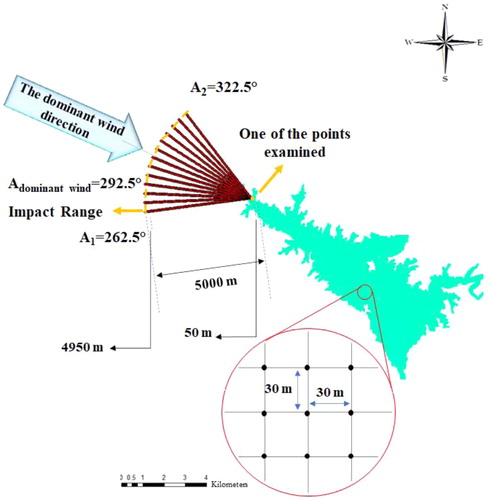
Figure 6. The average of differences of Sx in each consecutive 2 lengths for (a) Jun, (b) Jul, (c) Aug, and (d) Sep.
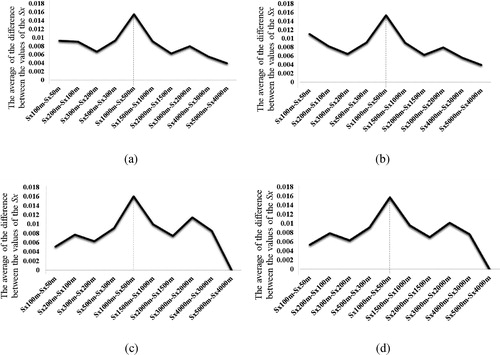
Table 1. Average values of water level and wind shelter index.
Table 2. Percent reduction in water surface height and increase in wind index in each month compared to the previous month.
Figure 7. Clustered area of Lake Dez dam on the basis of cluster analysis of Sx using Ward method in (a) Jun, (b) Jul, (c) Aug, and (d) Sep.
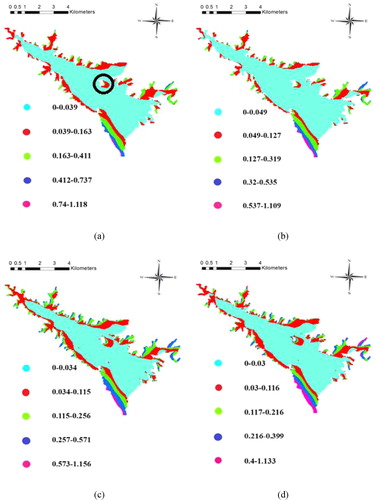
Table 3. Clustering statistical parameters using the Ward method.