
Figures & data
Figure 1. Site maps. (Top left) New England with Concord–Boston area highlighted, modified from Wikimedia Commons. (Top right) White and Walden Ponds in relation to Concord and Boston, modified from d-maps.com. (Bottom) Map of the White Pond watershed, with a contour map of the pond and land use classification of surrounding properties. Coring sites within the pond are indicated with stars. Land use map modified from ESS Group (Citation2016–2017), based on Town of Concord parcel data and USGS aerial imagery; contour map modified from MassWildlife (Citation2020).
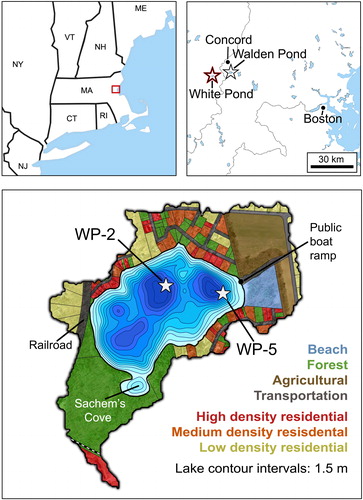
Figure 2. Benthic aquatic moss recovered from 15 m depth in White Pond. Millimeter scale shown above.
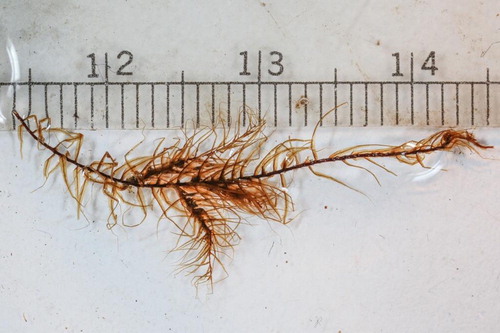
Figure 3. Lead-210 and sediment accumulation profiles with age–depth models for White Pond cores WP-2 (left) and WP-5 (right). Dotted lines indicate temporal uncertainty ranges for the age–depth models.
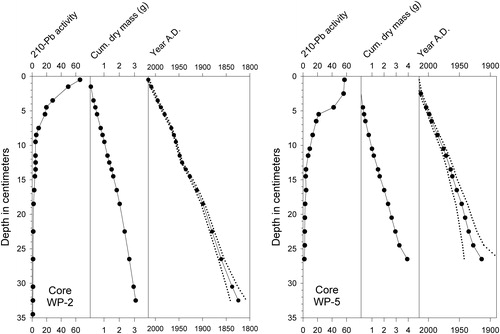
Table 1. Radiocarbon ages of sediment samples from White Pond cores WP-2 and WP-5. Age calibrations were conducted with CALIB 7.1 (Stuiver and Reimer Citation1993). Calibrated ages in parentheses are assumed to be anomalously old due to the Suess effect (see text).
Figure 4. Composite of linear age–depth models for core WP-2 using 210Pb (solid line) and radiocarbon dating (dotted line). The approximated intersection of the age–depth lines at ∼23–24 cm depth suggests that sediment accumulation rates accelerated during the late 19th century.
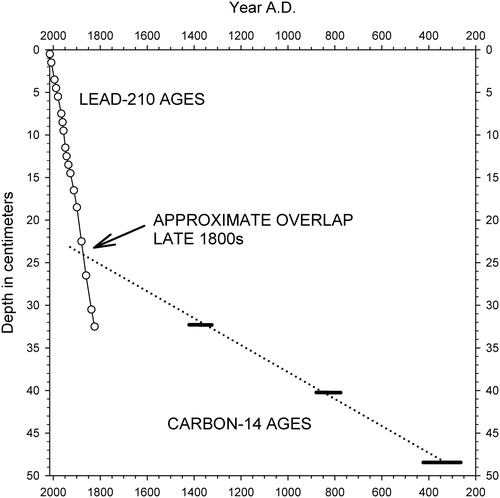
Figure 5. Stratigraphy of the most common diatom taxa in White Pond core WP-2. Ratios of chrysophyte scales to diatom valves indicated as "Scales:Diatoms." Organic content of sediments indicated by weight loss on ignition (%LOI). Horizontal dotted lines indicate qualitative assemblage zones A–E, as described in the text. STOCK indicates the onset of fish stocking in 1903. REC marks the time frame in which 2 reclamations occurred (see text). Ages of depth intervals based on 210Pb and radiocarbon dating are shown on right margin.
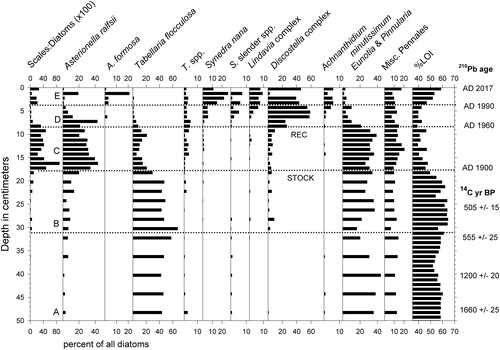
Figure 6. Stratigraphy of the most common diatom taxa in supplemental core WP-5. Ratios of chrysophyte scales to diatom valves indicated as "Scales:Diatoms." Horizontal dotted lines indicate major transitions in diatom assemblage composition of nature and timing similar to those in core WP-2. Ages of depth intervals based on 210Pb and radiocarbon dating are shown on right margin.
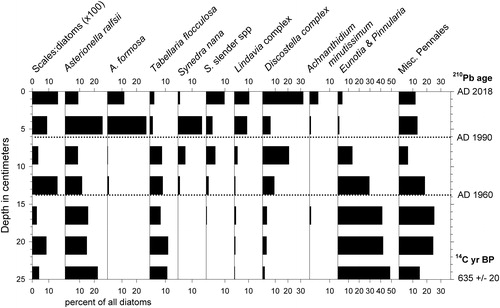
Figure 7. Diatom stratigraphy of Walden Pond core WAL-3, after Stager et al. (Citation2018). Ratios of chrysophyte scales to diatom valves indicated as "Scales:Diatoms." Organic content of sediments indicated by weight loss on ignition (%LOI). Ages of depth intervals based on 210Pb and radiocarbon dating are shown on right margin.
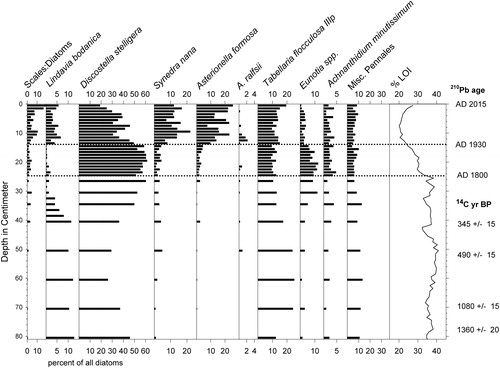
Figure 8. Summary of major changes in diatom assemblages and organic content in White Pond vs. time, in comparison to Walden Pond and weather records from Bedford, Massachusetts (National Centers for Environmental Information [NOAA] Citation2017). Percentages of diatoms in core WP-2 (A–D): (A) Eutrophication indicators A. formosa and Synedra species. (B) Centric Discostella and Lindavia species groups. (C) Asterionella ralfsii. (D) Benthic taxa including Eunotia, Pinnularia, and Achnanthidium. (E) Organic content of sediments indicated by weight loss on ignition (%LOI). (F) Percentages of A. formosa and S. nana indicating eutrophication in Walden Pond core WAL-3. Vertical dotted lines highlight approximate dates of major stratigraphic transitions in core WP-2: (1) Onset of the rise in percentages of A. ralsfii ca. 1900. (2) Onset of the rise in centric taxa and decline in benthic diatoms ca. 1960. (3) Onset of the latest rise in diatoms indicative of eutrophication during the early 1990s.
![Figure 8. Summary of major changes in diatom assemblages and organic content in White Pond vs. time, in comparison to Walden Pond and weather records from Bedford, Massachusetts (National Centers for Environmental Information [NOAA] Citation2017). Percentages of diatoms in core WP-2 (A–D): (A) Eutrophication indicators A. formosa and Synedra species. (B) Centric Discostella and Lindavia species groups. (C) Asterionella ralfsii. (D) Benthic taxa including Eunotia, Pinnularia, and Achnanthidium. (E) Organic content of sediments indicated by weight loss on ignition (%LOI). (F) Percentages of A. formosa and S. nana indicating eutrophication in Walden Pond core WAL-3. Vertical dotted lines highlight approximate dates of major stratigraphic transitions in core WP-2: (1) Onset of the rise in percentages of A. ralsfii ca. 1900. (2) Onset of the rise in centric taxa and decline in benthic diatoms ca. 1960. (3) Onset of the latest rise in diatoms indicative of eutrophication during the early 1990s.](/cms/asset/1a4f100a-2ade-46b3-aa06-47d378d96781/ulrm_a_1839606_f0008_b.jpg)