
Figures & data
Table 1. Data collected in 2015–2021 used to determine curtain condition and to test curtain effectiveness.
Figure 1. Klamath River from Upper Klamath Lake to the Pacific Ocean, and the dams of the Lower Klamath Hydroelectric Project including Iron Gate Dam.
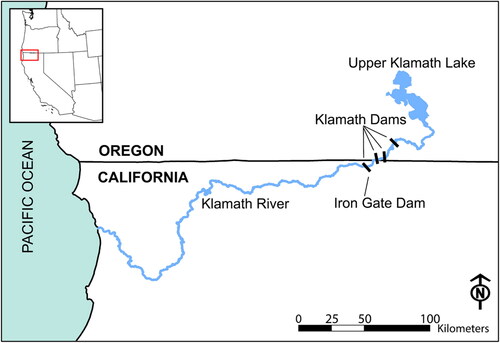
Figure 2. Iron Gate Reservoir (left), project area (right), approximate fetch used in Wedderburn number calculations (gray dashed dotted line), and sampling locations.
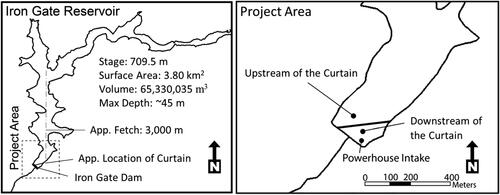
Figure 3. Iron Gate Reservoir upstream and downstream of the intake barrier curtain during deployment on 27 Jul 2017 (left) and Google Earth satellite image of Iron Gate Reservoir with intake barrier curtain deployment and downstream Klamath River on 23 Aug 2019 (right).
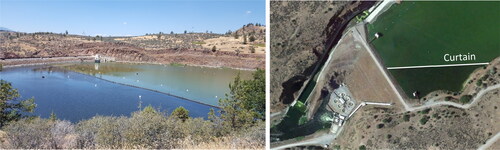
Figure 4. Basic thermal structure of water column with epilimnetic stratification in vicinity of the curtain and Wedderburn number (Wn) within the epilimnion. Red represents warmer and blue cooler temperatures in the continous temperature scale
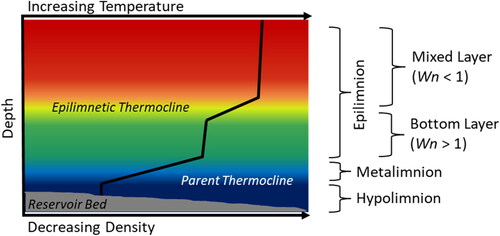
Figure 5. Same thermal conditions and different curtain depths (Z1, Z2, and Z3), with curtain conditions (C1, C2, and C3) based on curtain depth in relation to mixed layer depth (h). Curtain effectiveness at reducing cyanobacteria and toxins is expected to be highest during conditions present in the left panel, and to be reduced from left to right panels. Red represents warmer and blue cooler temperatures in the continous temperature scale.
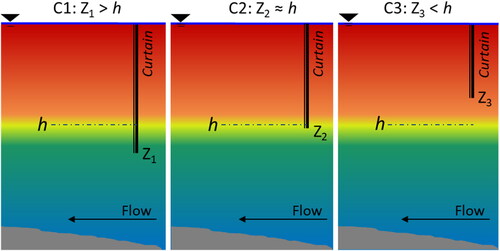
Figure 6. Different thermal conditions, same curtain depth (Z1) in relation to the mixed layer depth (h). Curtain effectiveness at reducing cyanobacteria and toxins is expected to be highest during conditions present in the left panel, and less effective during conditions present in the right panel. Red represents warmer and blue cooler temperatures in the continous temperature scale.
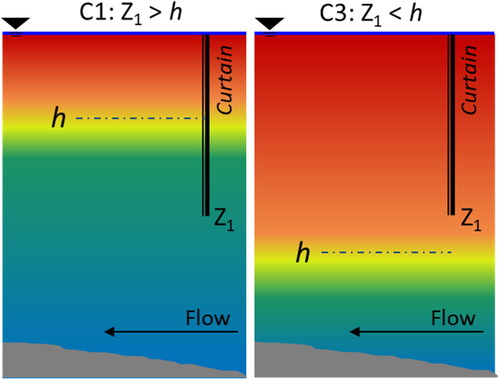
Table 2. Curtain condition based on curtain deployment depth (zc) and mixed layer depth (h), and sample depth subcategory based on sample depth (zs) in relation to h.
Figure 7. Daily average mixed layer depths (h and h2, based on Wedderburn number [Wn] and secondary Wn upstream of the curtain, respectively), curtain depths, and grab sample collection dates during (A) 2015, (B) 2016, (C) 2017, (D) 2018, (E) 2019, (F) 2020, and (G) 2021. The curtain was installed on 26 Jun 2015. No grab samples were collected in 2021.
![Figure 7. Daily average mixed layer depths (h and h2, based on Wedderburn number [Wn] and secondary Wn upstream of the curtain, respectively), curtain depths, and grab sample collection dates during (A) 2015, (B) 2016, (C) 2017, (D) 2018, (E) 2019, (F) 2020, and (G) 2021. The curtain was installed on 26 Jun 2015. No grab samples were collected in 2021.](/cms/asset/c1588c2a-4925-462b-8587-3159d4c3de2e/ulrm_a_2259854_f0007_b.jpg)
Figure 8. Hourly and daily average mixed layer depths (h and h2, based on Wn and secondary Wn upstream of the curtain, respectively) and deployed curtain (light gray shading) during (A) the first week of Jun 2018, (B) the first week of Aug 2018, and (C) the first week of Oct 2018.
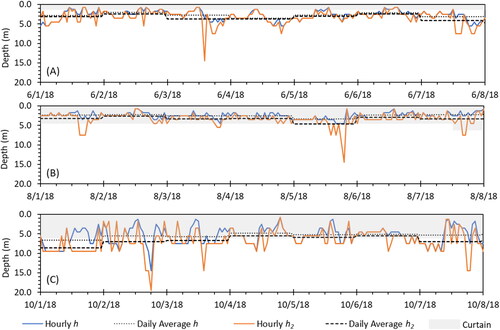
Figure 9. (a) Total chlorophyll a concentrations (µg/L) for 42 sample pairs collected upstream and downstream of the curtain at different depths and periods during curtain condition and sample depth subcategory C1a (curtain deeper than the mixed layer depth and sample depth shallower than or at the mixed layer depth) and (b) corresponding sample depths by date. Vertical lines with icon at 4 m denote pooled mixed layer sample from 0 to 4 m.
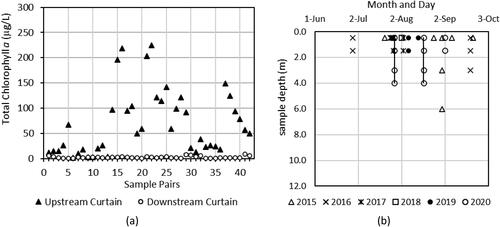
Figure 10. (a) Total chlorophyll a concentrations (µg/L) for 15 sample pairs collected upstream and downstream of the curtain at different depths during curtain condition and sample depth subcategory C1b (curtain deployed deeper than the mixed layer depth and sample depth deeper than the mixed layer depth) and (b) corresponding sample depths by date.
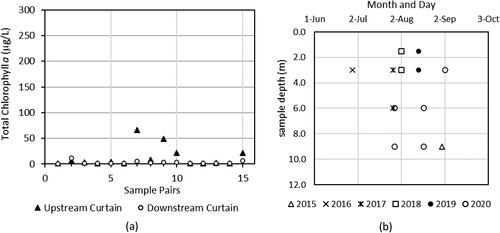
Figure 11. (a) Total chlorophyll a concentrations (µg/L) for 9 sample pairs collected upstream and downstream of the curtain at different depths during curtain condition and sample depth subcategory C2a (curtain deployed at approximately the mixed layer depth and sample depth shallower than or at the mixed layer depth) and (b) corresponding sample depths by date. Vertical line with icon at 4 m denotes pooled mixed layer sample from 0 to 4 m.
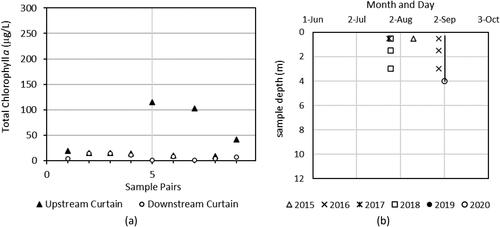
Figure 12. (a) Total chlorophyll a concentrations (µg/L) for 3 sample pairs collected upstream and downstream of the curtain at different depths during curtain condition and sample depth subcategory C3a (curtain deployed to a depth shallower than the mixed layer depth and sample depth shallower than or at the mixed layer depth) and (b) corresponding sample depths by date.
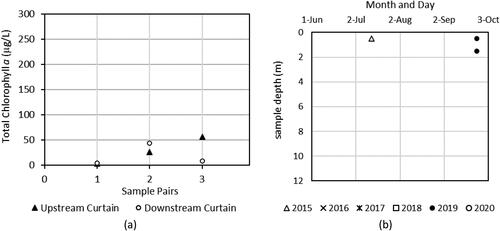
Figure 13. (a) Total chlorophyll a concentrations (µg/L) for 31 sample pairs collected upstream and downstream of the curtain while the curtain was not deployed and all sample depths (NDall), and (b) corresponding sample depths by date.
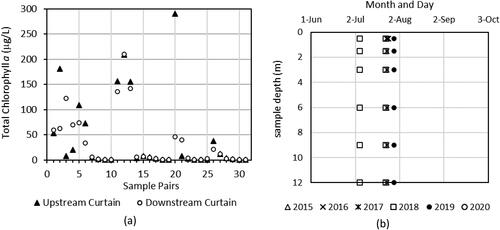
Table 3. Sign and Wilcoxon signed-rank test results for each curtain condition and sample depth subcategory for total chlorophyll a (µg/L) sample pairs (n).
Table 4. Sign and Wilcoxon signed-rank test results, mean bias, and mean percent reduction for each curtain condition and sample depth subcategory for total cyanobacteria (copies/mL), total Microcystis spp. (copies/mL), and total microcystin (µg/L) sample pairs (n).
