Figures & data
Figure 1. Map of Harlan County Reservoir, Nebraska (adapted from aerial imagery taken by the USDA-NRCS, 13 July 2016; surface water elevation ∼591 m.a.s.l.) and surrounding towns. Reservoir zones were previously established by Peterson et al. (Citation2005). Black triangles represent sampling stations within each zone.
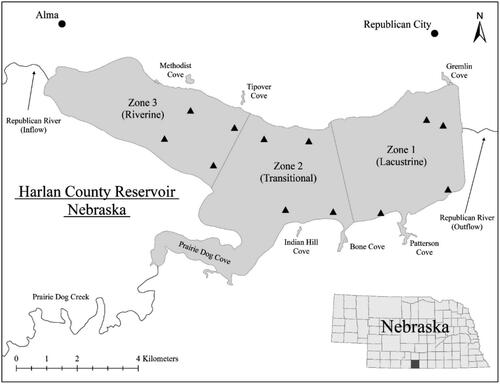
Figure 2. Map of coves within Harlan County Reservoir, Nebraska (adapted from aerial imagery taken by the USDA-NRCS, 13 July 2016; surface water elevation ∼591 m.a.s.l.). Black triangles represent sampling stations within each cove.
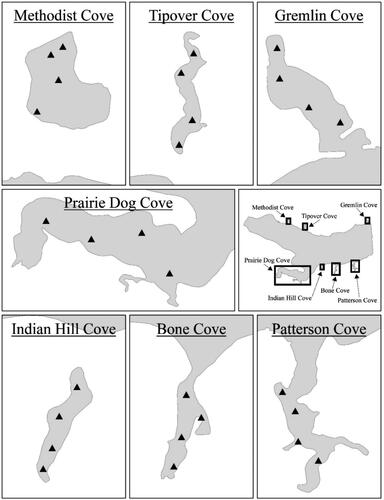
Figure 3. Elevation of the sediment berms disconnecting coves from the main reservoir, compared to end-of-month water level elevation of Harlan County Reservoir since January 1990. The gray line indicates the water elevation of the main reservoir, recorded at the dam spillway (USBOR Citation2020). Horizontal black lines indicate minimum water level required for connection (heights of sediment berm plus 1 m) for each corresponding cove. Vertical dotted lines indicate 1 January of the year labeled below. Initial berm height was calculated by Flatwater Group, Inc., 2017.
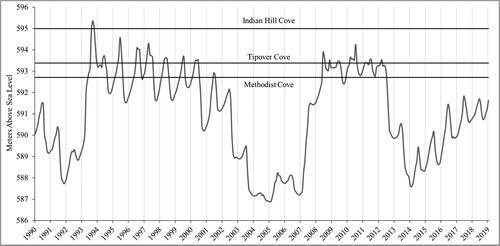
Figure 4. Mean (A) water temperature, (B) DO, and (C) pH across different habitat types in Harlan County Reservoir, Nebraska. Error bars denote 1 standard error.
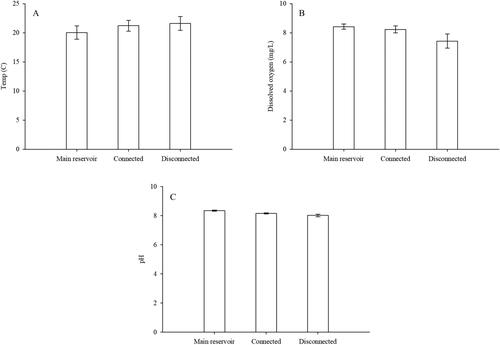
Figure 5. Mean (A) SDT, (B) turbidity, and (C) relative Chl-a across different habitat types in Harlan County Reservoir, Nebraska. The numerical axis for SDT has been inverted to better represent depth within the water column from the water surface. Error bars on all graphs denote one standard error. Lowercase letters denote significant differences based on a Tukey test (α = 0.10).
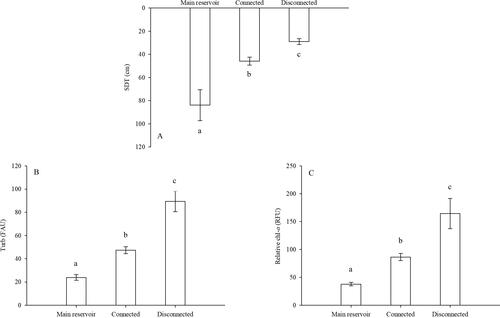
Figure 6. Mean (A) dissolved nitrates and (B) dissolved phosphates across different habitat types in Harlan County Reservoir, Nebraska. Error bars on all graphs denote one standard error.
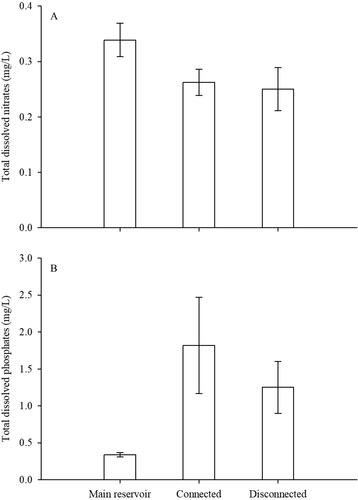
Figure 7. Mean total zooplankton density across different habitat types in Harlan County Reservoir, Nebraska. Error bars on all graphs denote one standard error. Lowercase letters denote significant differences based on a Tukey test (α = 0.10).
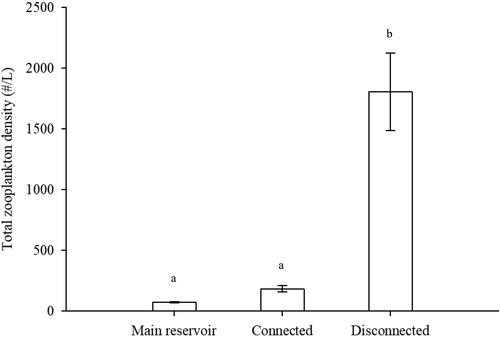
Figure 8. Comparison of the percent composition of zooplankton taxa groups within different habitat types (main reservoir, connected coves, and disconnected coves) in Harlan County Reservoir, Nebraska. Percent composition was calculated based on the total density of zooplankton across locations of those habitat types and season. Zooplankton taxa groups included in this figure consist of those with ≥1% of the total density of zooplankton for at least one of the 3 habitat types.
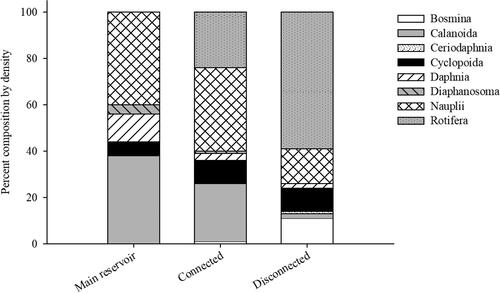
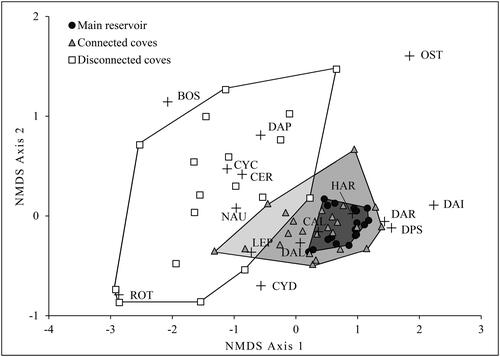
Figure 9. Plot of nonmetric multidimensional scaling (NMDS) of zooplankton taxa densities per liter at sampling location within Harlan County Reservoir. Polygons represent convex hulls around each habitat type in ordinal space; the white polygon represents disconnected coves, the light gray represents connected coves, and dark gray represents the main reservoir. The white squares, gray triangles, and black circles represent samples taken from disconnected coves, connected coves, and the main reservoir, respectively. Plus signs indicate zooplankton taxa used as vectors for this analysis, and the vector distance from point 0,0 indicates correlation strength. Taxa abbreviations are Bosmina, BOS, Calanoida, CAL, Ceridoaphnia, CER, Chydoridae, CYD, Cyclopoida, CYC, Daphnia pulicaria, DAP, Daphnia retrocurva, DAR, Daphnia lumholtzi, DAL, immature Daphnia, DAI, Diaphansoma, DPS, Harpacticoida, HAR, Leptodora, LEP, nauplii, NAU, Ostracoda, OST, and rotifers, ROT.