Figures & data
Figure 1. Map showing treatment and control zones, sampling sites, and silt curtain within Milford Gathering Pond. Further detailed explanation of sampling sites is included in the supplement.
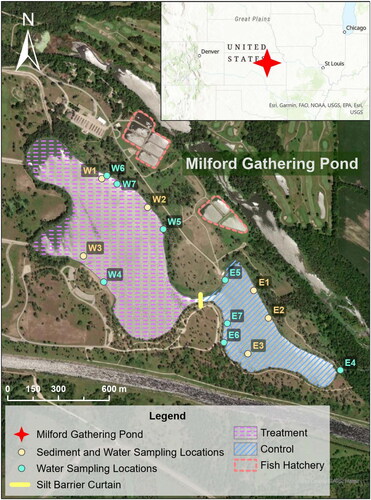
Table 1. Treatment design for laboratory algaecide efficacy experiments.
Figure 2. Pretreatment evaluation of average resting cell densities (n = 3) in site-collected sediments and average planktonic cell densities (n = 3) in overlying water following 14 d laboratory incubation studies (A) and average cell densities (n = 3) of planktonic cyanobacteria in situ at time of sampling (B) at Milford Gathering Pond. Error bars indicate ±1 SD. Samples were collected from sites W1, W2, and W3 for treatment zone and E1, E2, and E3 (shown in ) for control zone.
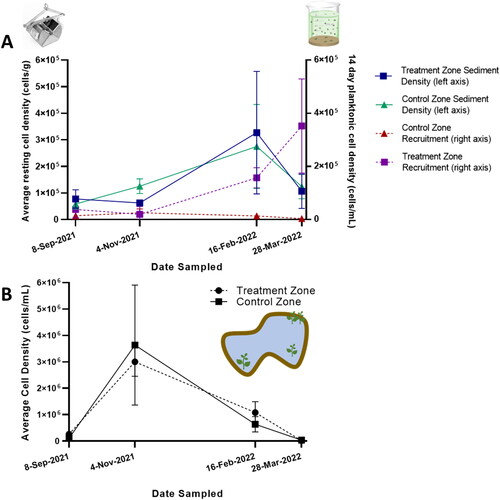
Figure 3. Average planktonic cyanobacteria cell densities (n = 3) following 18 d of incubation after laboratory algaecide experiments for single (2 graphs under A) and 2 hydrogen peroxide-based algaecide treatments (2 graphs under B). Granular sodium carbonate peroxyhydrate formulations are on left-hand side and liquid hydrogen peroxide formulation is on right-hand side. Error bars indicate ±1 SD.
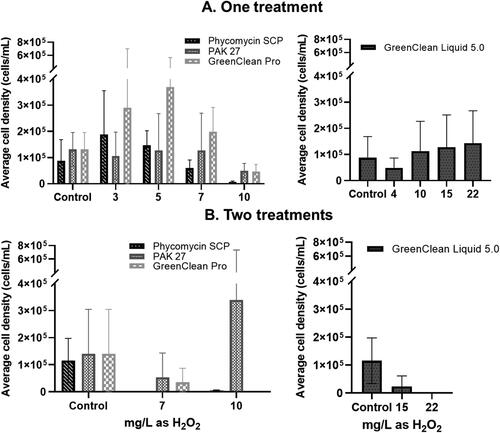
Figure 4. Immediate pre- and post-treatment evaluation of average resting cell densities (n = 3) in site-collected sediments (A), average planktonic cell densities (n = 3) in overlying water following laboratory incubation studies using site sediments (B), and average cell densities (n = 3) of planktonic cyanobacteria in situ at time of sampling 1 d before in-lake treatment (pretreatment) and 3 d after first in-lake treatment (post-treatment) (C) at Milford Gathering Pond. Error bars indicate ±1 SD. Samples were collected from sites W1, W2, and W3 for treatment zone and E1, E2, and E3 (shown in ) for control zone.
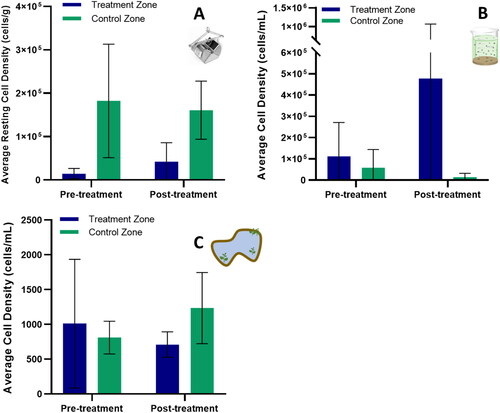
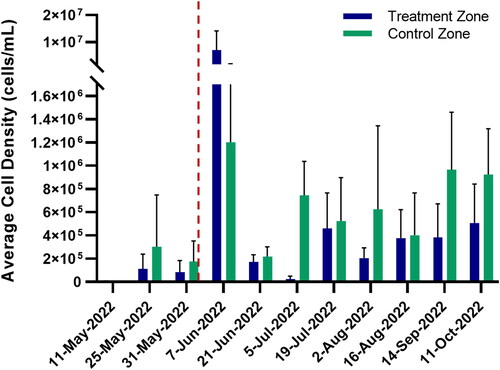
Figure 5. Average cell densities of planktonic cyanobacteria (n = 4) in treatment and control zones in the months following in-lake treatments at Milford Gathering Pond. Dashed line indicates date when fish hatchery released water containing HAB into treatment zone. Error bars indicate ±1 SD. Samples were collected from sites W4, W5, W6, and W7 for treatment zone and E4, E5, E6, and E7 for control zone ().