Figures & data
Figure 1. A watershed map showing sediment coring sites for Upper Red Lake (UC) and Lower Red Lake (LC) within the Red Lake Nation and Minnesota, USA. Black filled circles indicate cores with conformable sedimentation that were used for subsequent analyses, whereas white filled circles indicate rejected cores with problematic sedimentation identified with radiometric dating.
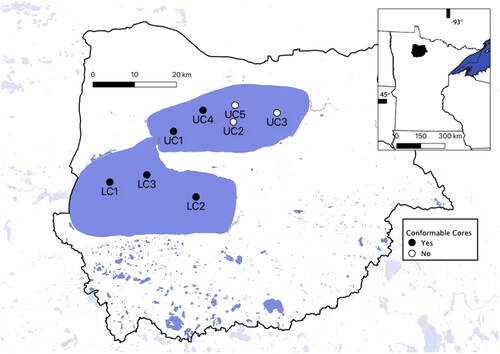
Table 1. Sediment core recovery information and geochemical proxies analyzed in addition to loss on ignition and 210Pb dating (Cs = 137Cs dating; phosphorus fractions, P-frac; diatoms, D; pigments, Pig).
Figure 2. Profiles for unsupported 210Pb (pCi/g), dry mass accumulation rate (DMAR; g/cm2/yr), and 210Pb age (calendar year) against core depth (cm) for sediment cores recovered from Upper Red Lake (dashed line) and Lower Red Lake (solid line). Lines and points are colored by coring location: LC1 (red), LC2 (olive green), LC3B (green), UC1 (blue), and UC4 (magenta).
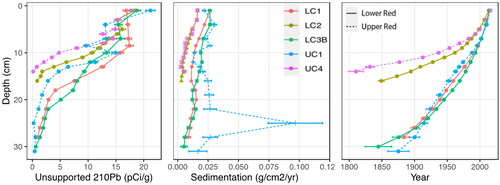
Figure 3. The percentage (dry weight %) and flux (mg/cm2/yr) of organic matter and biogenic Si, percent Fe-P, diatom-inferred total phosphorus (μg/L), and percentage of planktonic diatom taxa for Upper Red Lake (dashed line) and Lower Red Lake (solid line); sediment cores plotted by year on the y-axis. Lines and points are colored by coring location: LC1 (red), LC2 (olive green), LC3B (green), UC1 (blue), and UC4 (magenta).
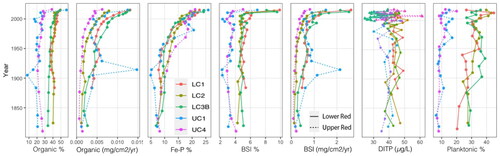
Figure 4. Two-dimensional solution for a nonmetric multi-dimensional scaling ordination of common diatoms observed in sediment cores from Upper Red Lake (dashed lines) and Lower Red Lake (solid lines); (stress = 0.14, non-metric stress r2 = 0.98).
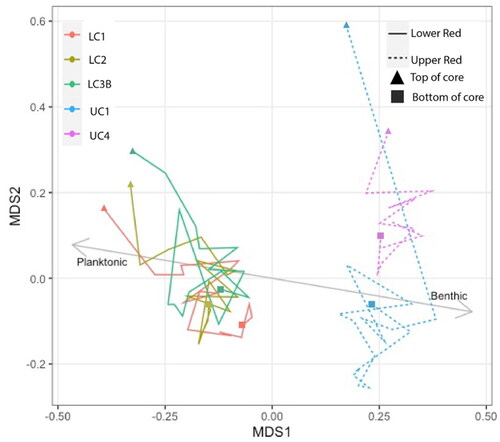
Figure 5. Stratigraphic plot of the dominant diatoms, as percent relative abundance, from the Upper Red Lake core UC1 plotted against 210Pb age (year) on the y-axis. The solid blue line represents a significant break in the constrained cluster analysis of diatom assemblages as shown on the right.
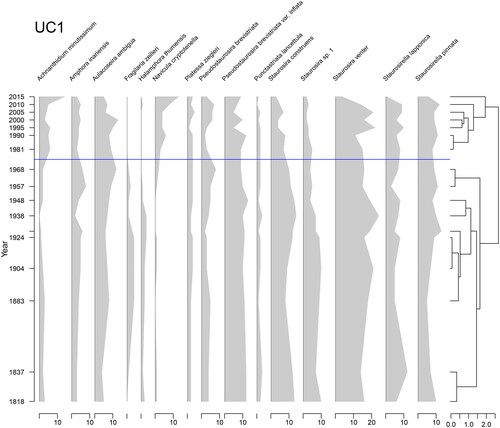
Figure 6. Stratigraphic plot of the dominant diatoms, as percent relative abundance, from the Lower Red Lake core LC1 plotted against 210Pb age on the y-axis. A constrained cluster analysis of diatom assemblages as shown on the right.
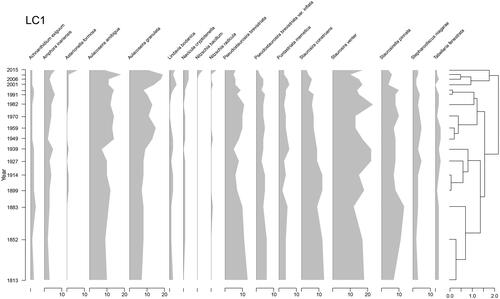
Figure 7. Box plots of monitored total phosphorus (μg/L), chlorophyll a (μg/L) and Secchi depth (m) for 5 sampling stations in Lower Red Lake (left) and Upper Red Lake (right). The red lines on each plot represent the Northern Lakes and Forests (NLF) ecoregion criteria for TP, Chl-a, and Secchi depth (Heiskary and Wilson Citation2008).
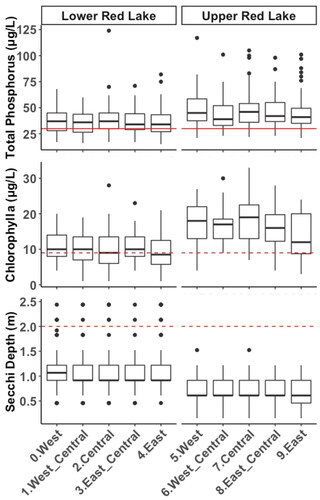
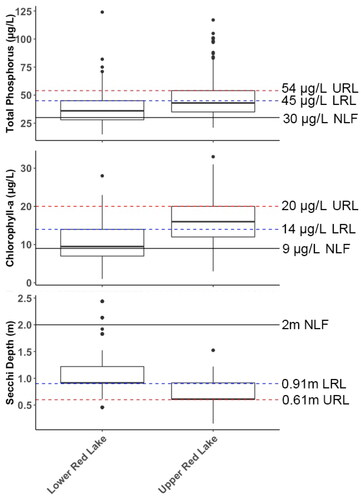
Figure 8. Box plots of monitored total phosphorus (μg/L), chlorophyll a (μg/L), and Secchi depth (m) averaged by lake for Lower Red Lake (left) and Upper Red Lake (right). The solid black lines on each plot represent the NLF ecoregion nutrient criteria for TP, Chl-a, and Secchi depth. The dashed blue lines represent suggested site-specific standards for Lower Red Lake (LRL) and the dashed red line represents suggested standards for Upper Red Lake (URL) sufficient to protect aquatic life and recreational uses. Boxes are bisected by the median and represent the interquartile range (IR), dots represent outliers, and whiskers represent the maximum and minimum as defined by the IR limits plus and minus 1.5 × IR, respectively.