
Figures & data
Figure 1. Recovery of heavy crude oil in the spiked sand using Soxhlet extraction (in green) with toluene (Tol), dichloromethane (DCM), acetone:n-hexane (1:1, v:v) (AceHex), methanol (MeOH), and supercritical CO2 extraction (extract in blue, residue in brown).
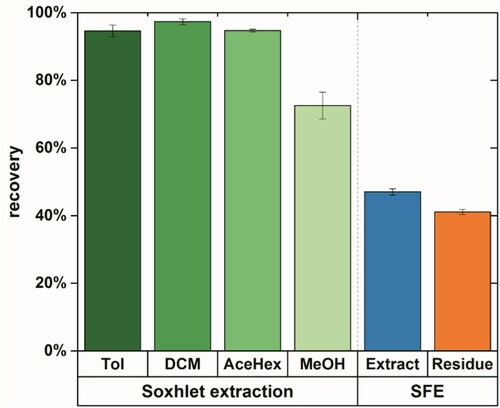
Figure 2. Recombined (left column) and zoomed in mass spectra at m/z 400 (right column) for the original crude oil sample, analyzed by FT Orbitrap MS using positive mode ESI (red), negative mode ESI (blue), positive mode APCI (green), and APPI (orange), respectively.
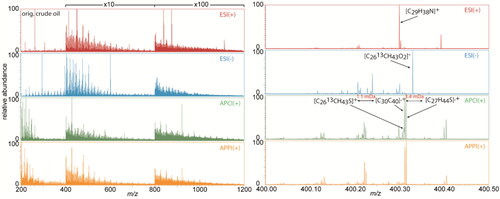
Figure 3. Zoomed in mass spectra at m/z 400 for the original crude oil (black), Soxhlet extract using dichloromethane (green), SFE extract (blue), and SFE residue (brown) using positive mode APPI FT Orbitrap MS. Some signals are highlighted with calculated elemental compositions and double bond equivalent (DBE) values, separated with a comma.
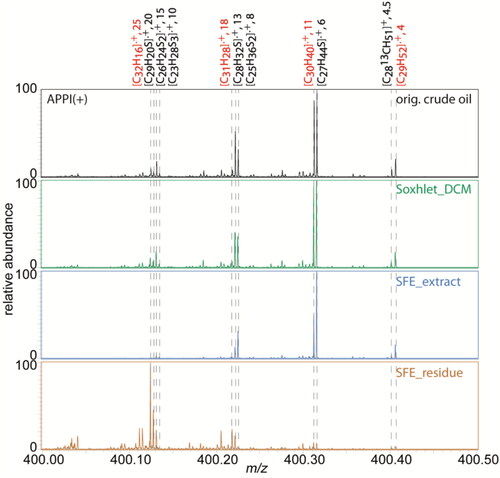
Figure 4. Intensity based class distributions for the Soxhlet extracted sample using dichloromethane, analyzed by positive/negative mode ESI, positive mode APCI/APPI (top to bottom) FT Orbitrap MS with protonated/deprotonated molecules in red, radical cations in blue, and molecules with sodium adduct in green.
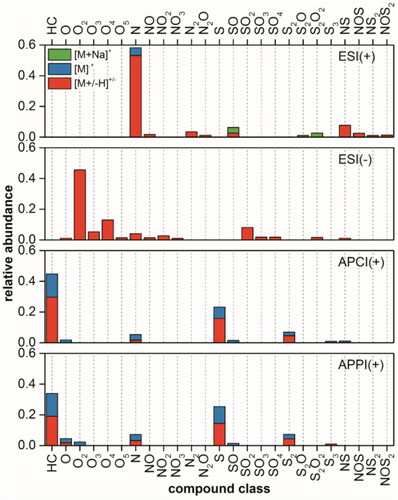
Figure 5. Intensity (top) and population (bottom) based class distributions for the original crude oil, spiked sand Soxhlet extracted using Tol, DCM, AceHex, or MeOH and its SFE extract (SFE E) and residue (SFE R), analyzed by positive mode APPI FT Orbitrap MS. Protonated molecules and radical cations are denoted in red and blue, respectively.
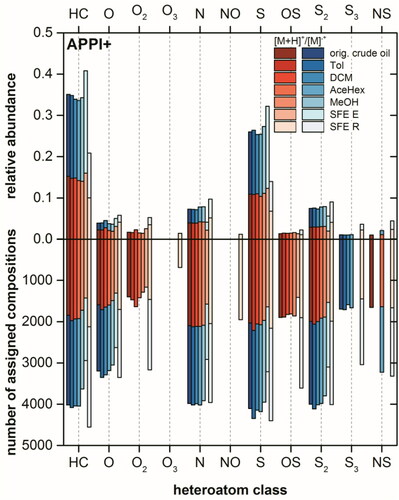
Figure 6. Intensity (top) and population (bottom) based class distributions for the original crude oil, spiked sand Soxhlet extract using Tol, DCM, AceHex, or MeOH and its SFE extract (SFE E) and residue (SFE R), analyzed by positive mode-APCI FT Orbitrap MS.
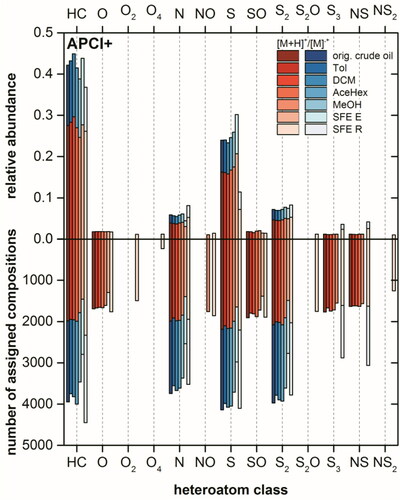
Figure 7. Intensity (top) and population (bottom) based class distributions for the original crude oil, spiked sand Soxhlet extract using Tol, DCM, AceHex, or MeOH and its SFE extract (SFE E) and residue (SFE R), analyzed by positive (left) and negative (right) mode-ESI FT Orbitrap MS. Protonated molecules and radical cations are denoted in red and blue, respectively.
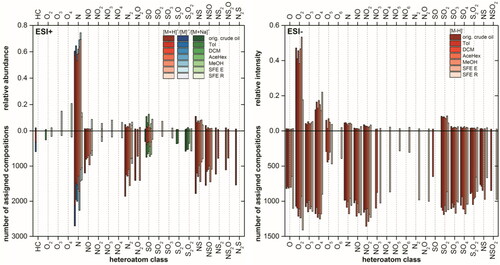
Figure 8. Intensity based DBE vs. class distributions for the original crude oil, Soxhlet extract using DCM, SFE extract and residue (from top to bottom) using positive mode APPI FT Orbitrap MS (radical cations: M, protonated molecules: M[H]).
![Figure 8. Intensity based DBE vs. class distributions for the original crude oil, Soxhlet extract using DCM, SFE extract and residue (from top to bottom) using positive mode APPI FT Orbitrap MS (radical cations: M, protonated molecules: M[H]).](/cms/asset/2bc02ea3-1355-4b18-8a18-b7b4b938fbf7/gpol_a_1748665_f0008_c.jpg)
Table 1. Calculated mean values of m/z, DBE, number of carbon atoms and X/C for the samples, analyzed using APPI(+) FT Orbitrap MS.
Figure 9. DBE vs. carbon count/intensity (Kendrick) plots for the radical HC (left column), [N + H]+ (middle column) and [N − H]− (right column) classes in the original crude oil, Soxhlet extract using DCM, SFE extract and residue (from top to bottom) using positive mode APPI or positive/negative mode ESI FT Orbitrap MS. Upper abscissa for the absolute intensity in a given DBE and lower abscissa for the number of carbon atoms in a assigned composition.
![Figure 9. DBE vs. carbon count/intensity (Kendrick) plots for the radical HC (left column), [N + H]+ (middle column) and [N − H]− (right column) classes in the original crude oil, Soxhlet extract using DCM, SFE extract and residue (from top to bottom) using positive mode APPI or positive/negative mode ESI FT Orbitrap MS. Upper abscissa for the absolute intensity in a given DBE and lower abscissa for the number of carbon atoms in a assigned composition.](/cms/asset/5392abb9-7070-4c79-9f5f-7f2c56854ca0/gpol_a_1748665_f0009_c.jpg)