Figures & data
Table 1. Details of the ten male biathletes participating in the study.
Figure 1. Illustration of the course profile with the relative elevation compared to sea level as a function of skiing distance in kilometers. The three vertical dotted lines illustrate from left to right the physical lines in the snow marking the start, the beginning of the uphill, and the entrance to the shooting range, respectively. Please note that the terrain was already rising slightly during the 100 m before the line in the snow indicating the beginning of the uphill.
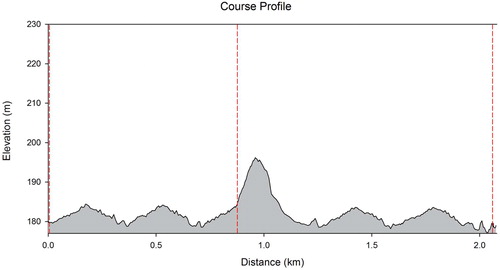
Table 2. Average instantaneous heart rate (IHR) in beats per minute in the 30 s leading up to the biathlon events for the different participants. In parentheses, increase+/decrease- in IHR over the same period.
Figure 2. Graph showing the increase in mean instantaneous heart rate (IHR) as a function of the time-to-start at t = 0 during the countdown preceding the start. The included nine participants are represented by the black lines with different symbols. The dotted vertical line separates the first from the last 15 s of the 30 s countdown period to the start signal.
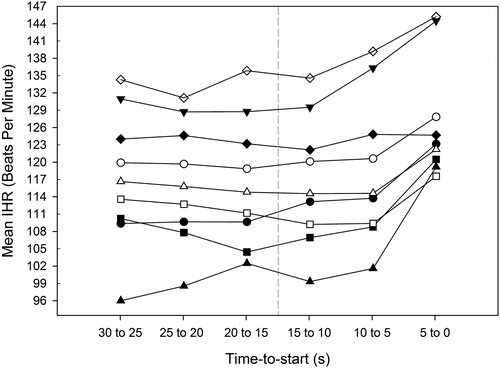
Figure 3. (Top) Graph showing the increase in mean instantaneous heart rate (IHR) as a function of the time-to-uphill at t = 0 as the participants were approaching the uphill and continued skiing up the hill in the experimental condition to the left, and as participants were skiing the same stretch but continued skiing the flat control lap to the right. The included eight participants are represented by the black lines with different symbols. The black dotted vertical lines separate the first from the last 15 s of the 30 s period leading up to the line in the snow indicating the start of the uphill. (Bottom) Graph showing that mean IHR increased steadily during the 30 s leading up to the line in the snow marking the beginning of the uphill. In addition, as participants were approaching the beginning of the uphill, IHR was consistently higher when they had to continue skiing up the hill as opposed to when they should veer off immediately after crossing the line and stay on the flat instead.
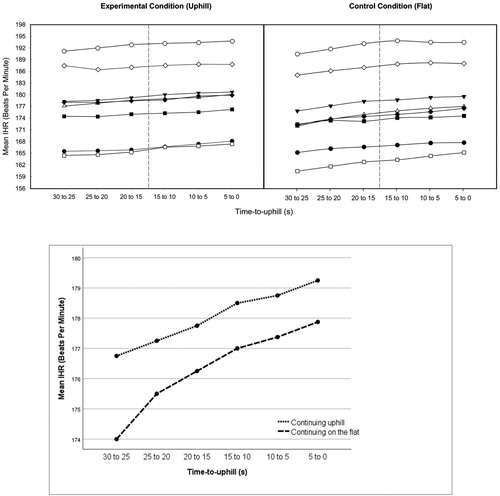
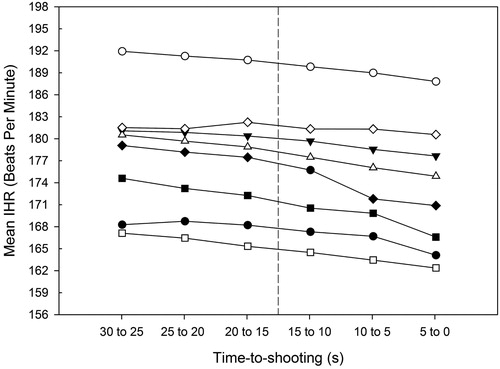
Figure 4. Graph showing the decrease in mean instantaneous heart rate (IHR) as a function of the time-to-shooting at t = 0 when participants were approaching the shooting range. The included eight participants are represented by the black lines with different symbols. The dotted vertical line separates the first from the last 15 s of the 30 s period leading up to shooting.