Figures & data
Figure 1. Normalized Nusselt number distribution in ascending mixed convection flows.
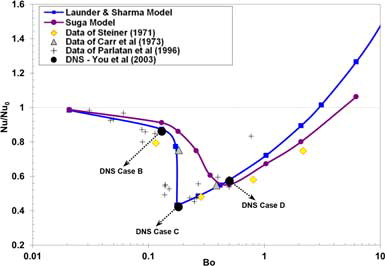
Table 1. DNS cases from You et al. [Citation18].
Table 2. Functions appearing in the LS and Suga turbulence models.
Table 3. Constants appearing in the LS and Suga models.
Table 4. Constants appearing in the Reynolds shear stress equation of the Suga model.
Table 5. Results for fully developed forced convection.
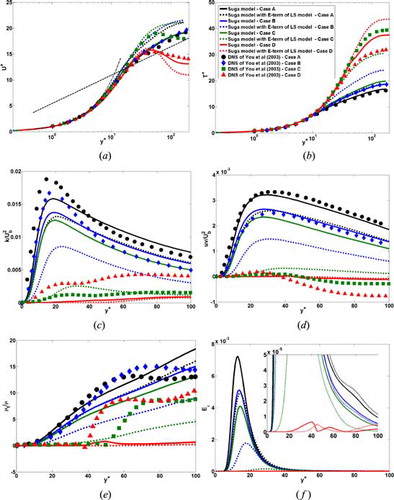
Figure 2. Normalized friction coefficient distribution in ascending mixed convection flows.
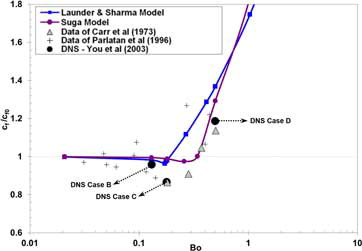
Figure 3. Mean flow profiles obtained using the Suga and Launder–Sharma models.
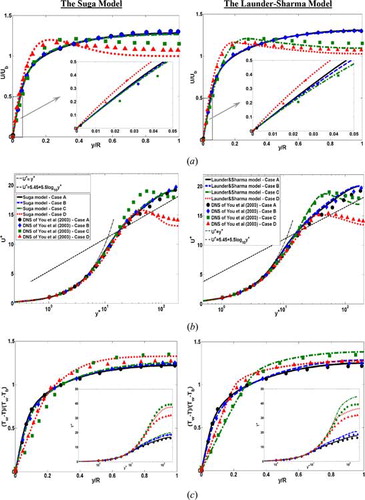
Figure 4. Turbulence parameters of the Suga and LS models.
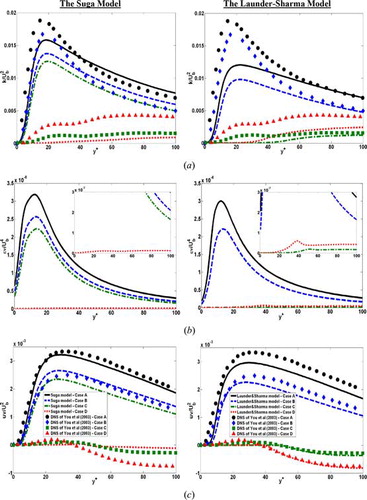
Figure 5. Turbulent viscosity ratio and damping function from the Suga and LS models.
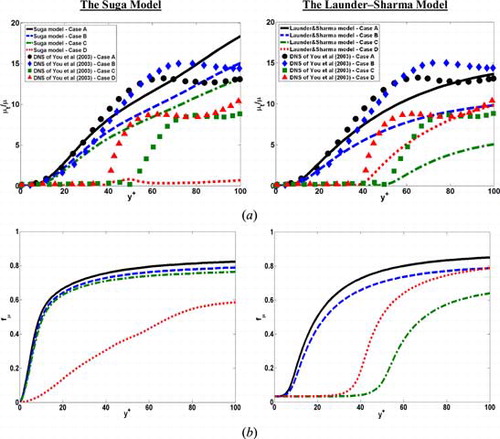
Figure 6. Budgets of turbulent kinetic energy obtained using the Suga and Launder–Sharma model; (a) Case A (forced convection) and (b) Case C (laminarization).
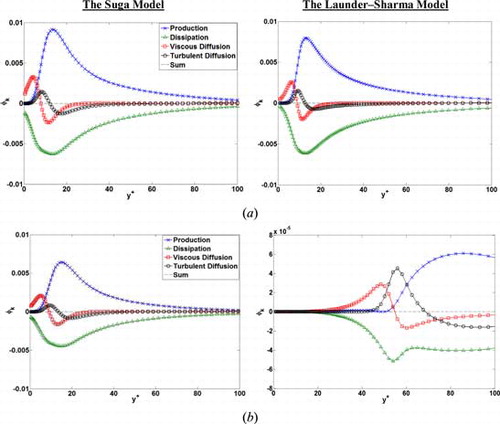
Figure 7. Distribution of various low-Reynolds number functions in the Suga model.
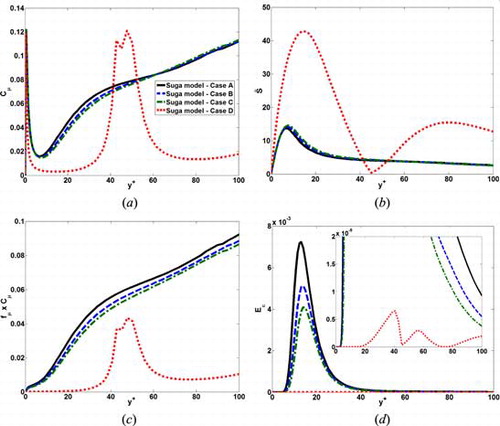
Figure 8. Effects of setting Cμ = 0.09 in the Suga model.
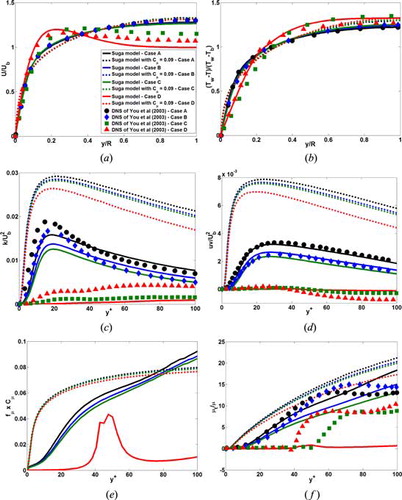
Figure 9. Effects of using a new Cμ expression in the Suga model.
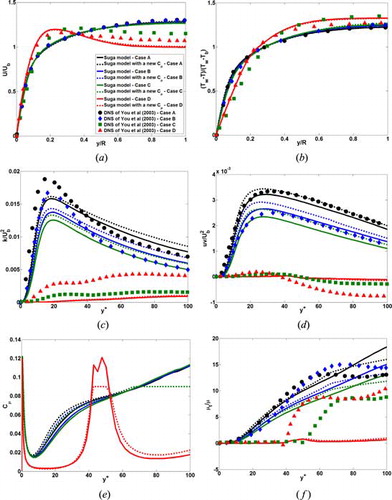
Figure 10. Effects of replacing the E-term of the original Suga model with that of the LS model.