Figures & data
Figure 1. Schematic of the computational domain.
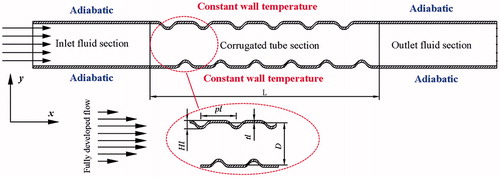
Table 1. Geometrical dimensions of the simulation tubes.
Table 2. Properties of working fluids.
Figure 2. Computational grid used in the numerical simulations.
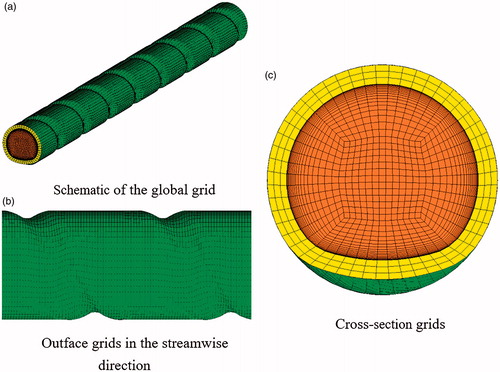
Table 3. Mesh independence test.
Figure 3. Validation of RSM with experimental data of inward helically corrugated tubes and empirical correlations of smooth tube.
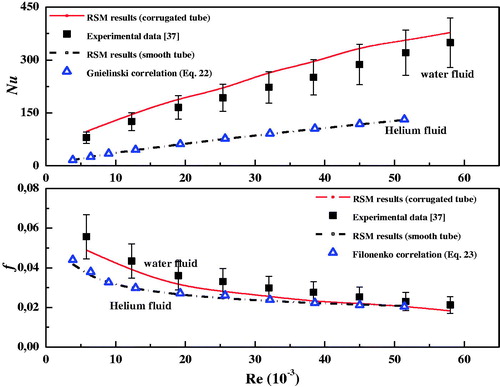
Figure 4. Validation of numerical entropy generation model with Bejan’s formula.
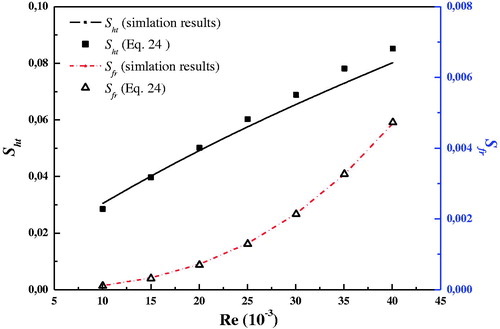
Figure 5. Velocity vectors at the longitudinal section for the five cases (Re = 20,030).
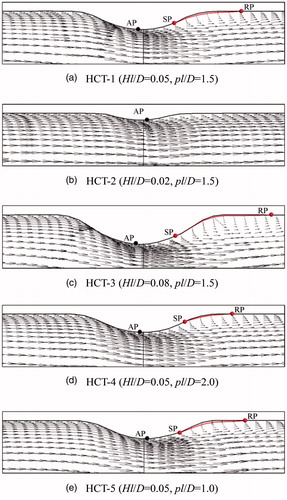
Figure 6. Velocity vectors at the cross section for the five cases (Re = 20,030).
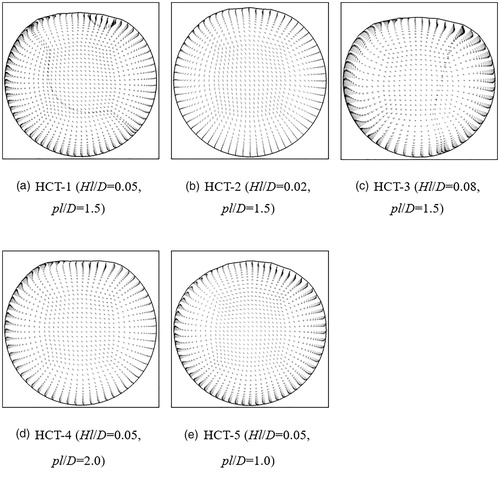
Figure 7. TKE distribution at the longitudinal section for the five cases (Re = 20,030).
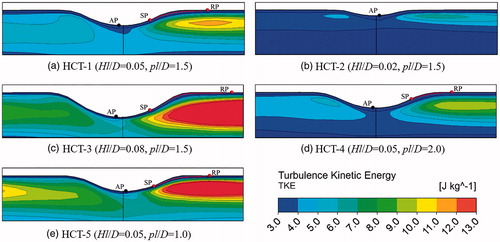
Figure 8. Distribution of the local heat transfer entropy generation rate for the five cases (Re = 20,030).
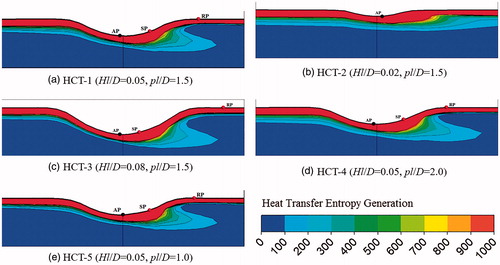
Figure 9. Distribution of the local friction entropy generation rate for the five cases (Re = 20,030).
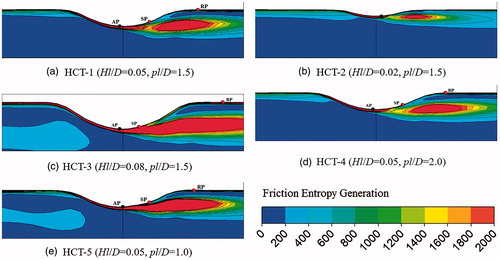
Figure 10. Distribution of the local total entropy generation rate for the five cases (Re = 20,030).
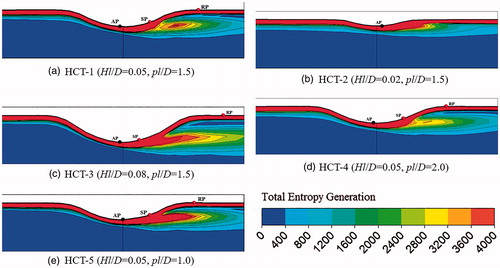
Figure 11. Distribution of local Be for the five cases (Re = 20,030).
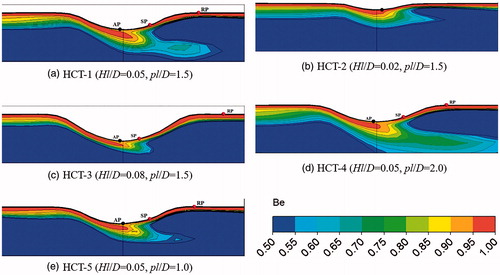
Figure 12. Variation of average heat transfer and friction entropy generation for different pl/D and Hl/D.
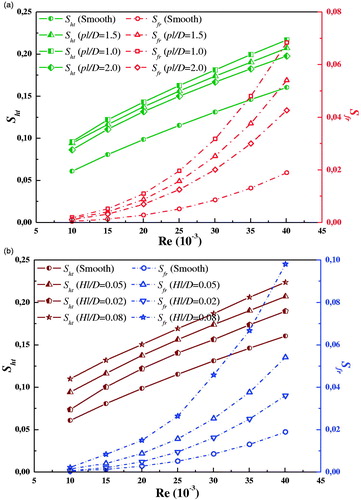
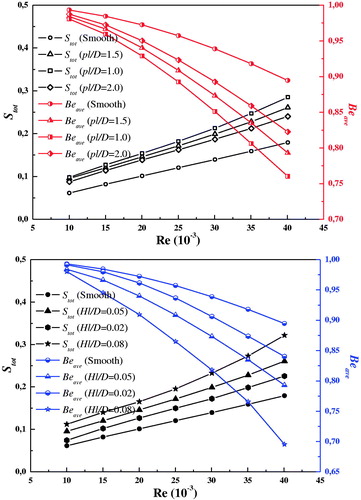
Figure 13. Variation of average total entropy generation and Be for different pl/D and Hl/D.