
Figures & data
Figure 1. Layout of the cascade with the endwall cooling configuration (a) Top to down view of the normal cascade; (b) The side view of the normal case.
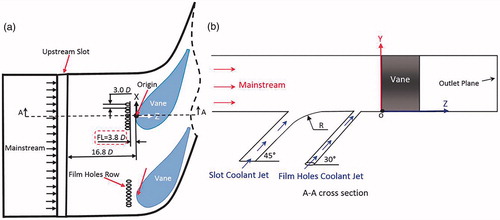
Table 1. Geometric and flow conditions
Figure 2. Overview of the cascade with endwall cooling configurations.
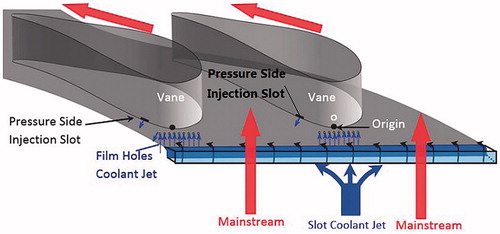
Figure 3. Mesh of the cascade with and without pressure injection slot (a) Normal case without pressure side injection slot; (b) The case with pressure side injection slot.
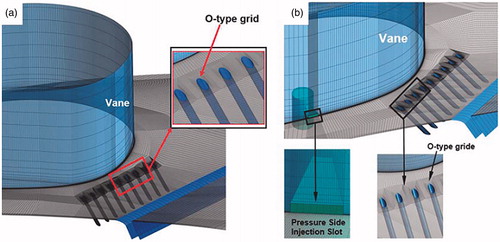
Table 2. Numerical method
Figure 4. Cooling performance and flow field near of the endwall surface (a) Cooling effectiveness on endwall; (b) Flow streamlines near the endwall.
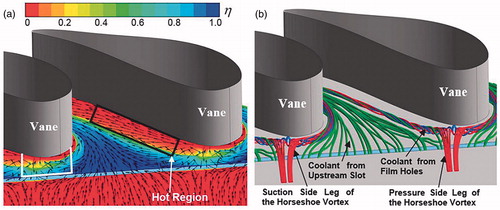
Table 3. Area-averaged cooling effectiveness near the vane leading edge
Figure 5. Three pressure side injection slot from the top view (a) Normal slot; (b) Expanded slot; (c) Convergent slot.
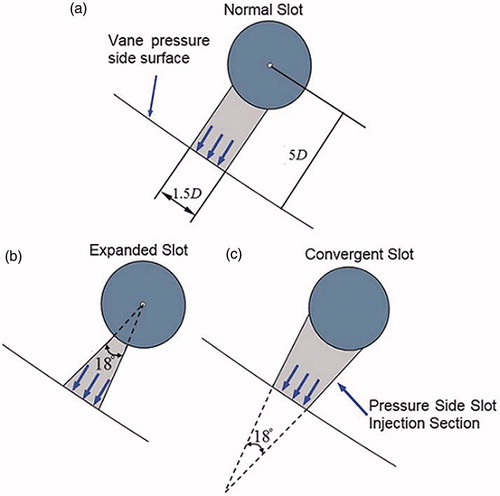
Figure 6. Adiabatic cooling effectiveness on the endwall surface.
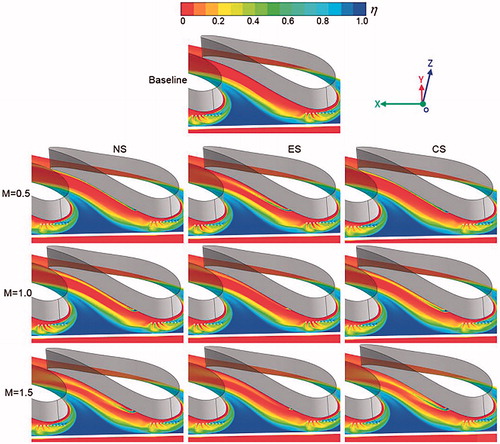
Figure 7. Laterally-averaged cooling effectiveness on the endwall.
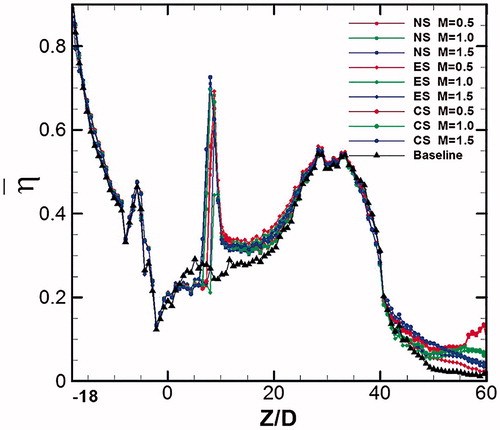
Figure 8. Adiabatic cooling effectiveness on the pressure side endwall surface.
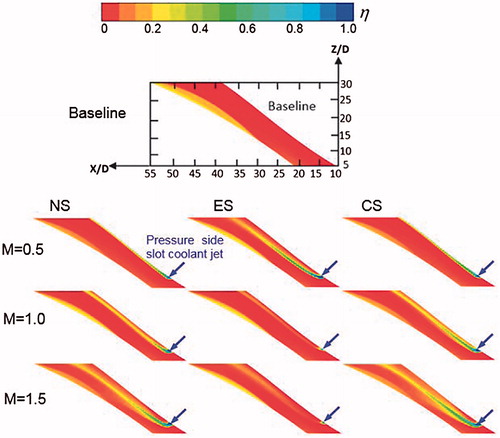
Figure 9. Laterally-averaged adiabatic cooling effectiveness on the pressure side endwall surface.
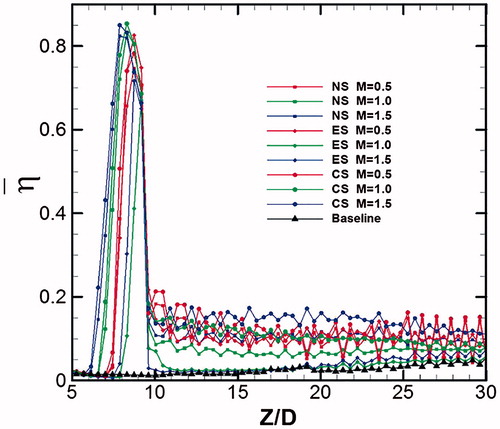
Figure 10. Flow structure near the endwall surface.
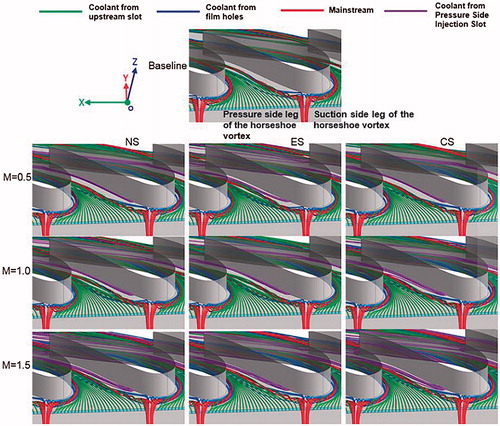
Figure 11. Cooling effectiveness, flow and thermal fields near the vane pressure side.
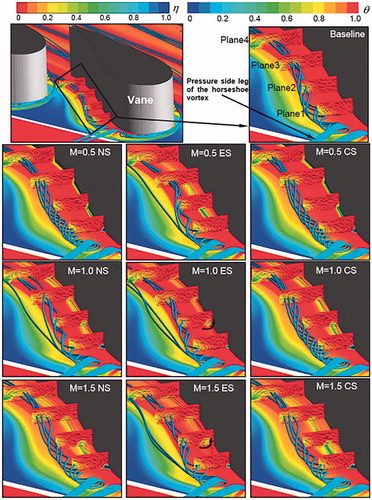
Figure 12. Flow structure and the temperature distribution near the vane pressure side.
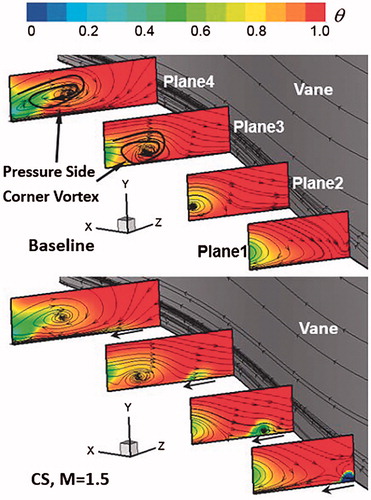
Figure 13. Total pressure loss coefficient on the outlet plane.
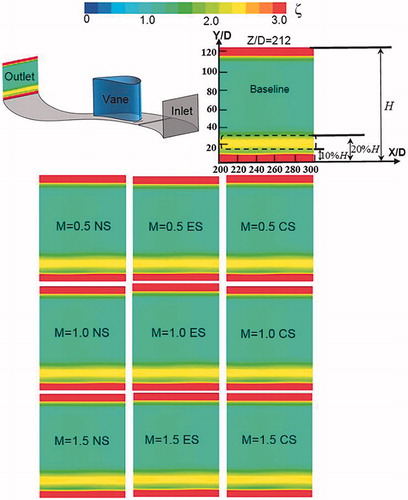
Figure 14. Total pressure loss coefficient along the span-wise direction at the outlet plane.
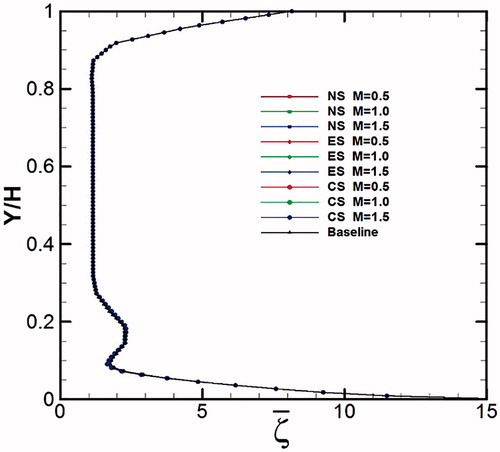
Table 4. Area-averaged cooling effectiveness long pressure side
Table 5. Area-averaged total pressure loss coefficient along the span wise direction at the outlet plane