Figures & data
Figure 1. Typical cooling structure of gas turbine blade.
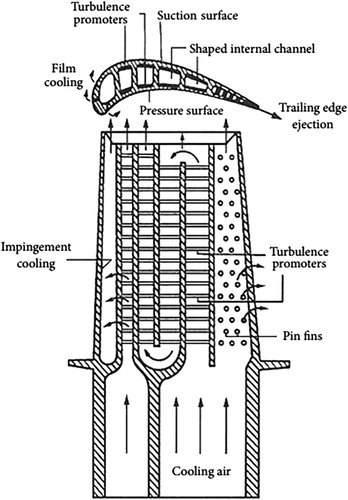
Figure 2. General schematics of the computational model.
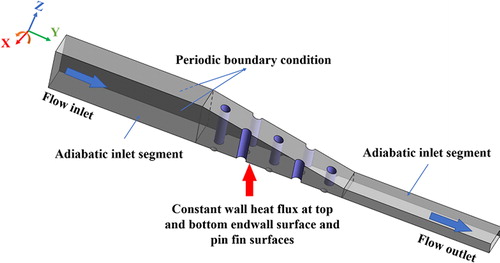
Figure 3. Detailed schematics of the computational model. (a) Wedge duct configuration; (b) Dimpled endwall configuration; (c) Pin fin and dimple configuration; (d) Dimple configuration.
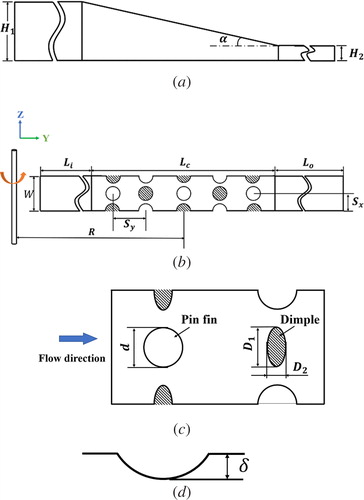
Figure 4. Concept of rotation.
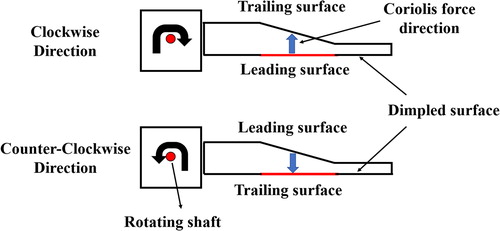
Figure 5. Comparison of the CFD results and the experimental results.
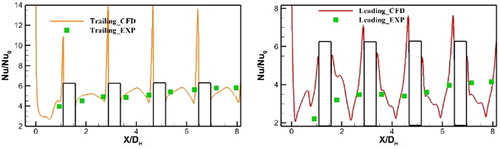
Table 1. Studied cases.
Figure 6. The mesh details.
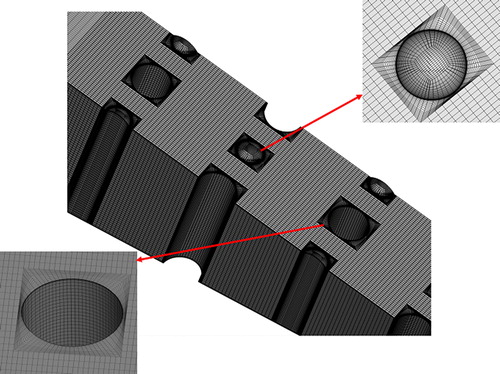
Table 2. Grid independence check.
Figure 7. Comparison of the area-averaged Nusselt number on the dimpled endwall for ranging from -0.4 to 0.4.
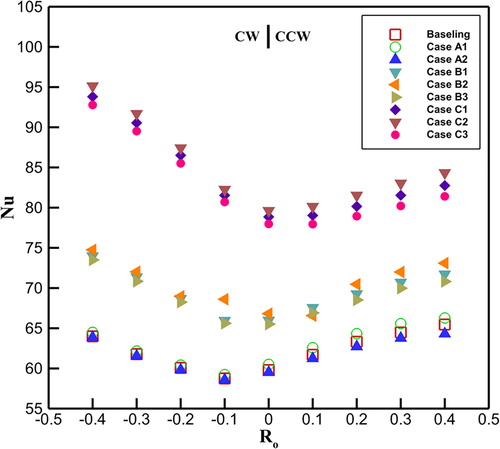
Figure 8. Comparison of the Nusselt number distributions at the dimpled endwall surface for the Baseline, Case B1 and Case C1 at = 0.3.
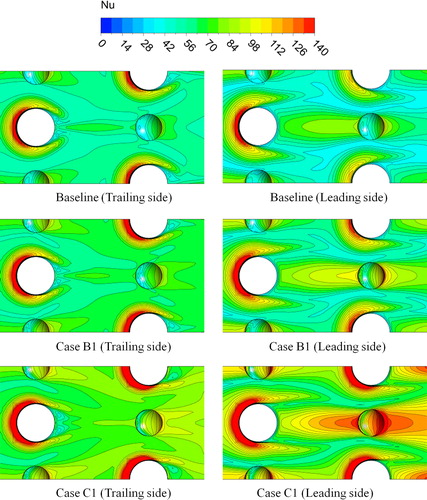
Figure 9. Comparison of the vorticity isosurface and streamline distributions in the vicinity of the pin fin for the Baseline, Case B1 and Case B1 at = 0.3.
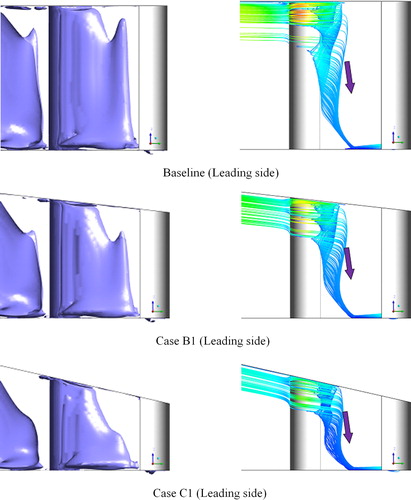
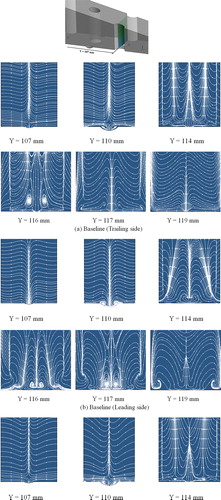
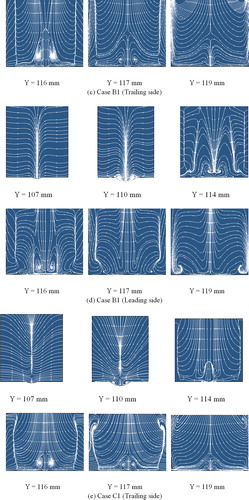
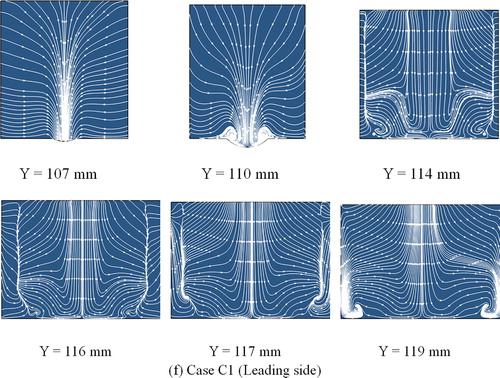
Figure 11. Comparison of the limiting streamline distributions at the dimpled endwall surface for the Baseline, Case B1 and Case C1 at = 0.3.
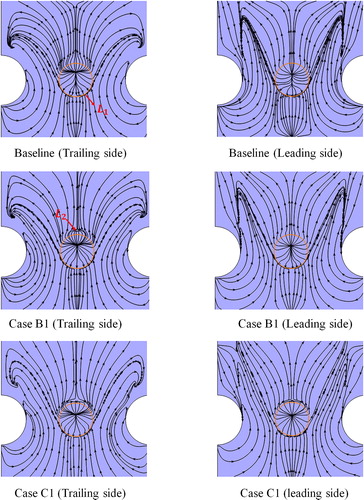
Figure 12. Comparison of the Nusselt number distributions along the centerline on the dimpled endwall surface for Cases C1, C2, and C3 at = 0.3.
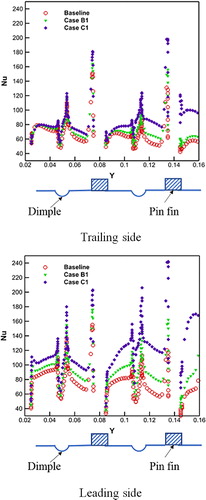
Figure 13. Comparison of the Nusselt number distributions on the dimpled endwall surface for Cases C1, C2, and C3 at = 0.2.
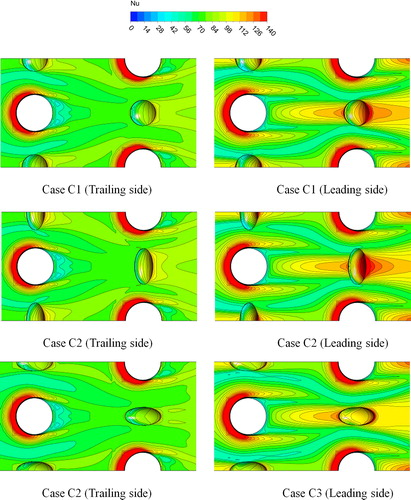
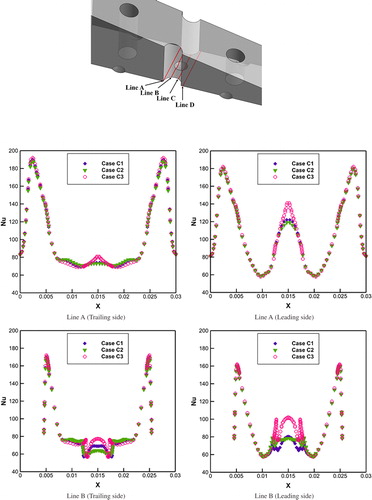
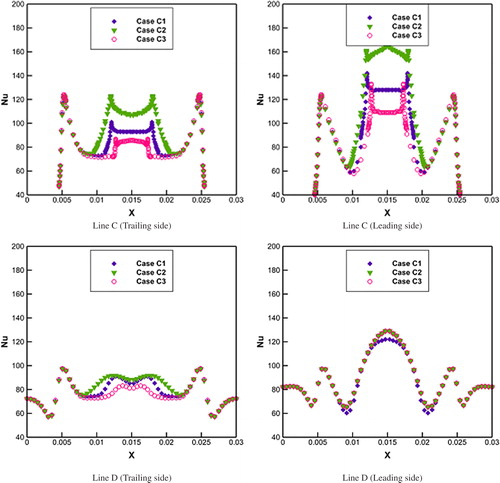
Figure 15. Comparison of the TKE distributions at the central streamwise plane for Cases C1, C2, and C3 at = 0.2.
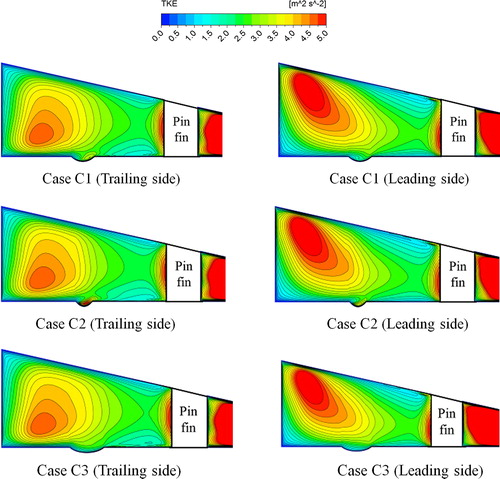
Figure 16. Comparison of the swirling strength at the spanwise plane for Cases C1, C2, and C3 at = 0.2.
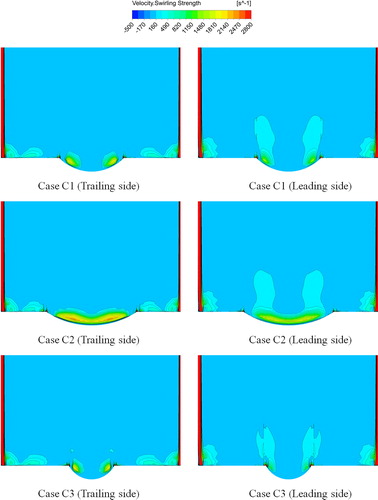
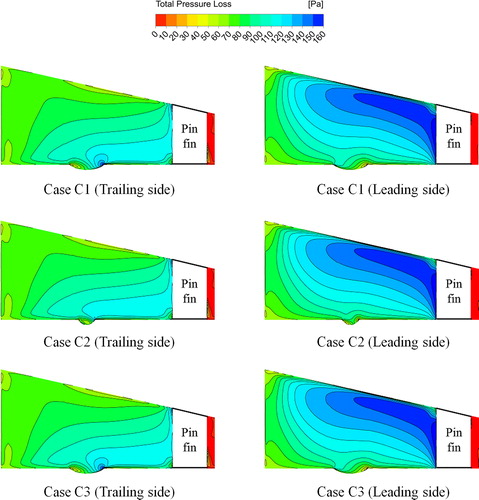
Figure 17. Comparison of the total pressure loss at the central longitudinal plane compared to the inlet total pressure for Cases C1, C2, and C3 at = 0.2.