Figures & data
Figure 1. Typical cooling structure of gas turbine [Citation3].
![Figure 1. Typical cooling structure of gas turbine [Citation3].](/cms/asset/6a2793f1-d147-417b-a992-6ac1e90787cc/unht_a_1630235_f0001_b.jpg)
Figure 2. General schematics of the computational model.
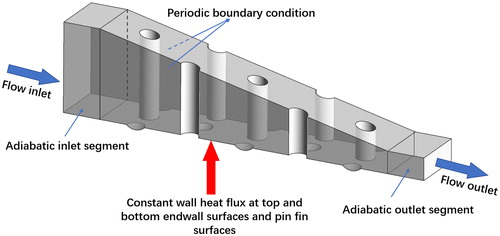
Figure 3. Detailed schematics of the computational model.
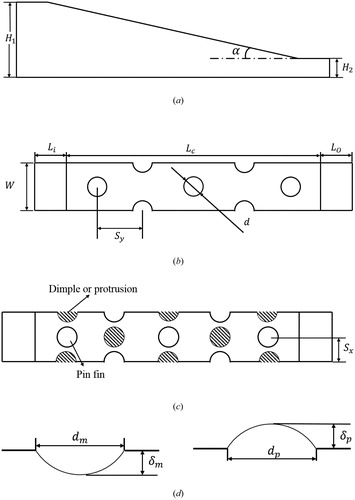
Table 1. Studied cases.
Figure 4. Comparison of the CFD results and the experimental results.
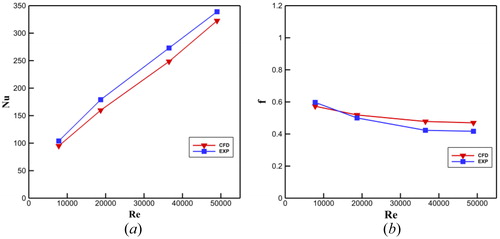
Figure 5. The mesh details.
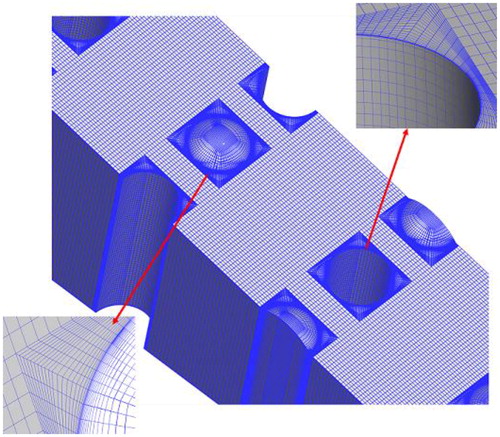
Table 2. Grid independence study.
Figure 6. Comparison of the streamline distributions and TKE distributions at the central longitudinal plane at Re = 30,000.
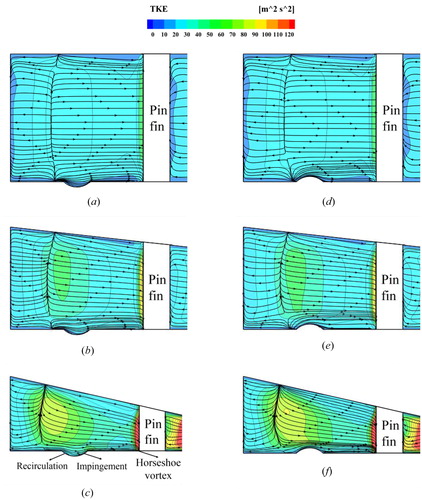
Figure 7. Comparison of the streamline distributions and TKE distributions near the dimple/protrusion at Re = 30,000.
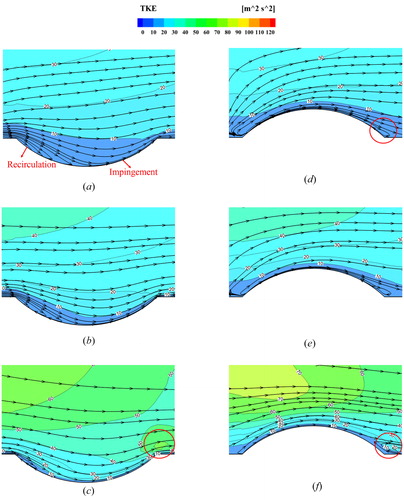
Figure 8. Comparison of the streamline distributions and vorticity distributions at spanwise planes perpendicular to the streamline at Re = 30,000.
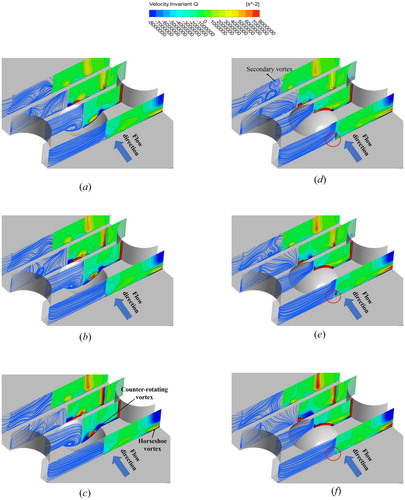
Figure 9. Comparison of the limiting streamline distributions at the endwall surface at Re = 30,000.
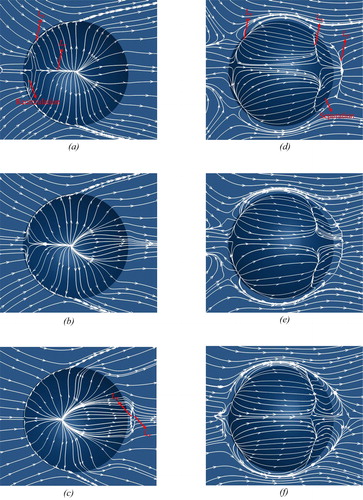
Figure 10. Comparison of the viscous dissipation function on the central longitudinal plane at Re = 30,000.
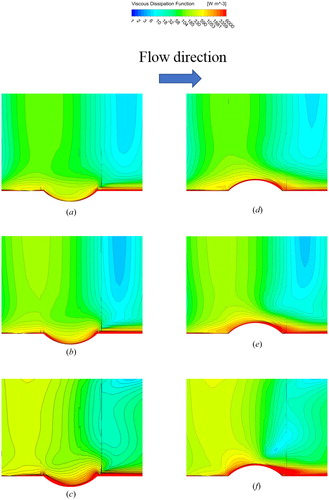
Figure 11. Comparison of the Nusselt number distribution at the endwall surface at Re = 30,000.
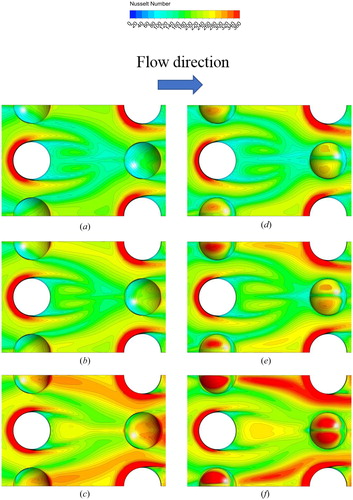
Figure 12. Comparison of the Nusselt number distributions along the streamwise centerline at the endwall surface at Re = 30,000.
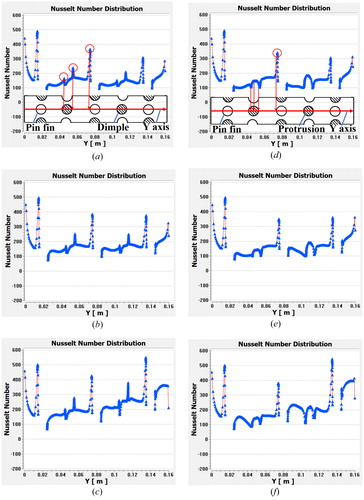
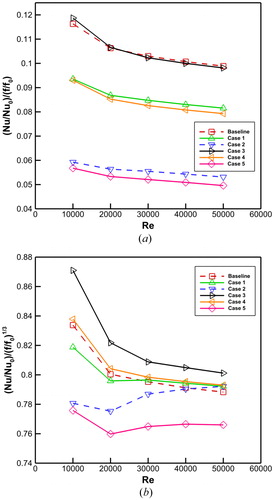
Figure 13. Comparison of the normalized area-averaged Nusselt numbers for Re ranging from 10,000 to 50,000.
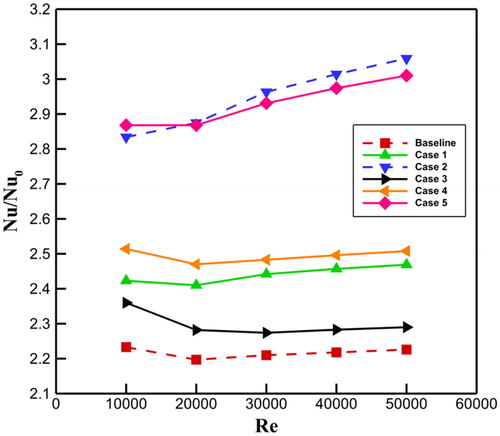
Figure 14. Comparison of the normalized friction factors for Re ranging from 10,000 to 50,000.
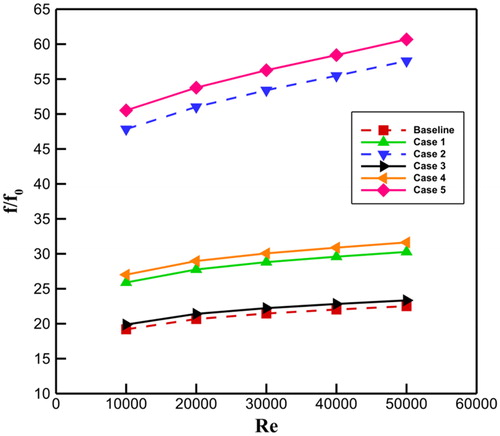
Figure 15. Comparison of the thermal performance of the whole wedge duct for Re ranging from 10,000 to 50,000.