Figures & data
Figure 1. Schematic diagram of the considered channel.
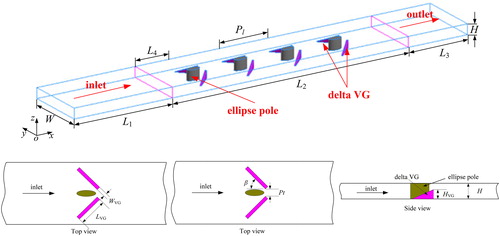
Table 1. Geometric dimension of the LVG for Case F.
Figure 2. Nu and f-factor comparisons for various major axis lengths of the elliptical pole.
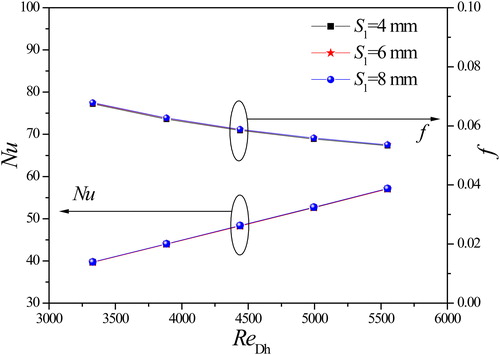
Figure 3. Nu and f-factor comparisons for various short axis lengths of the elliptical pole.
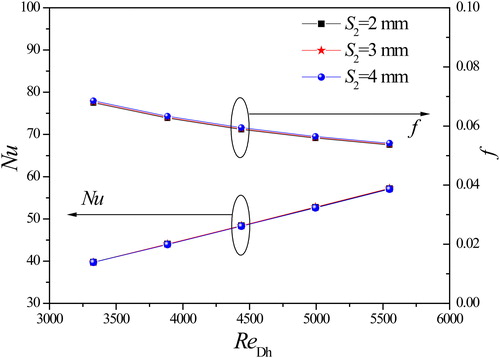
Figure 4. Nu and f-factor comparisons for various LVG thicknesses.
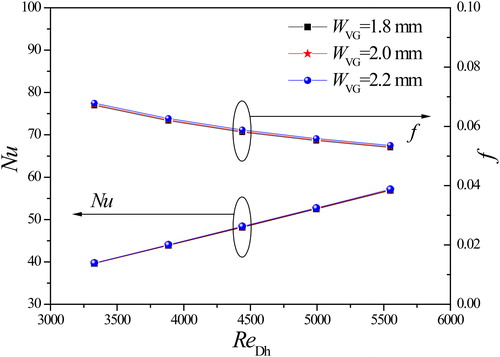
Figure 5. Nu and f-factor comparisons for various LVG lengths.
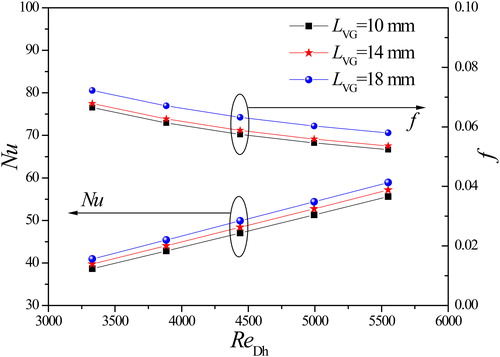
Figure 6. Velocity distributions at different cross sections at uin = 0.8 m/s.
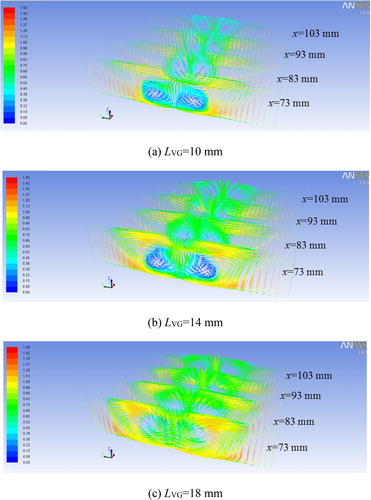
Figure 7. Nu and f-factor comparisons for various LVG heights.
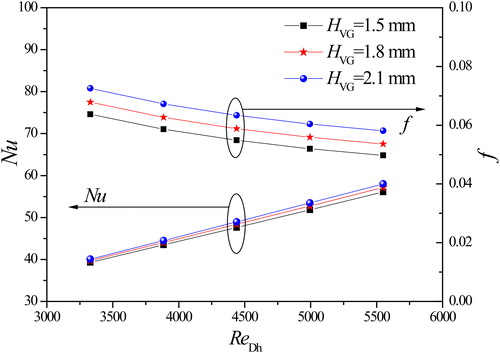
Figure 8. Nu and f-factor comparisons for various LVG attack angles.
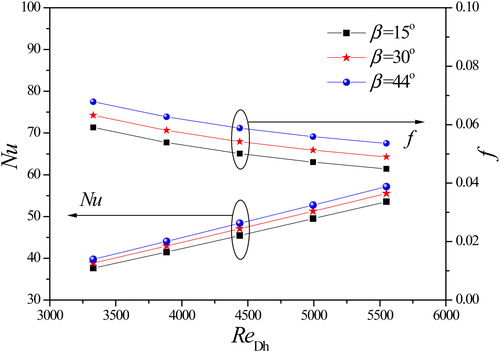
Figure 9. Velocity distributions at different cross sections at uin = 0.8 m/s.
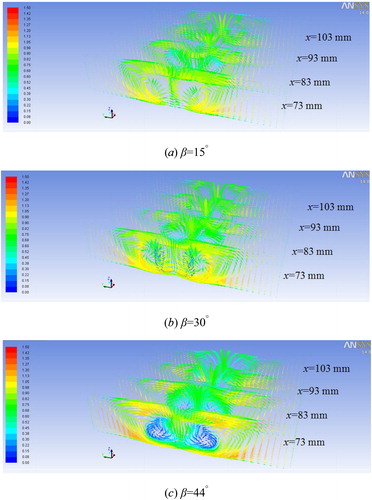
Figure 10. Nu and f-factor comparisons for various transverse pitches.
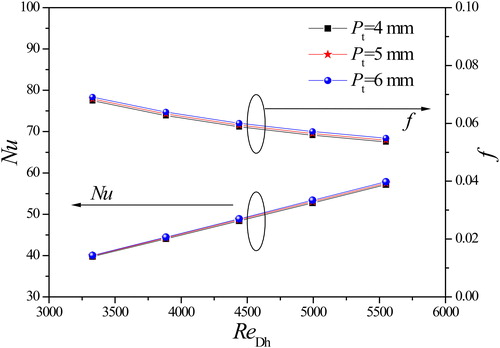
Figure 11. Nu and f-factor comparisons for various longitudinal pitches.
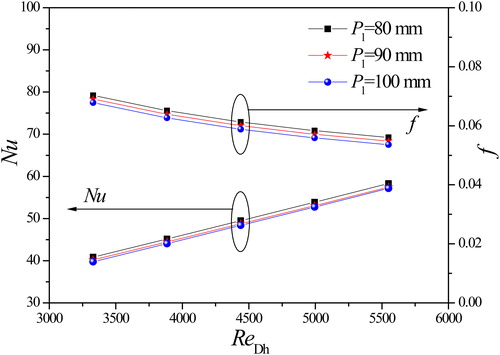
Table 2. Levels of each factor in this study.
Table 3. The orthogonal array of L16 (54).
Figure 12. Contribution ratio of each factor.
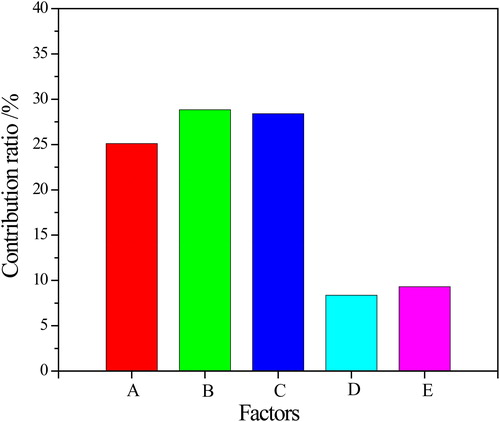
Table 4. SN ratio for each case.
Table 5. Factorial effect and contribution ratio.
Figure 13. SN ratio of each factor.
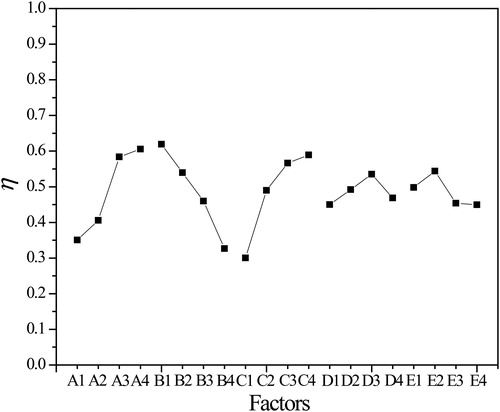
Table 6. Optimal conditions from factorial effect analysis.
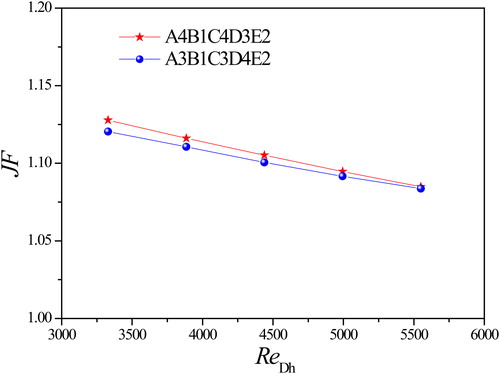
Figure 14. JF factor comparison of two optimal conditions.