Figures & data
Figure 1. Geometry model and computational domain. (a) AGTB-B1 blade [28] in a cascade [29]. (b) Computational domain with boundary condition.
![Figure 1. Geometry model and computational domain. (a) AGTB-B1 blade [28] in a cascade [29]. (b) Computational domain with boundary condition.](/cms/asset/4cdd0173-4f78-4a61-a3b5-c950a2ad5675/unht_a_1713692_f0001_c.jpg)
Table 1. Cascade geometry and parameters.
Table 2. Boundary conditions and particle properties.
Figure 2. Flowchart of the deposition computation.
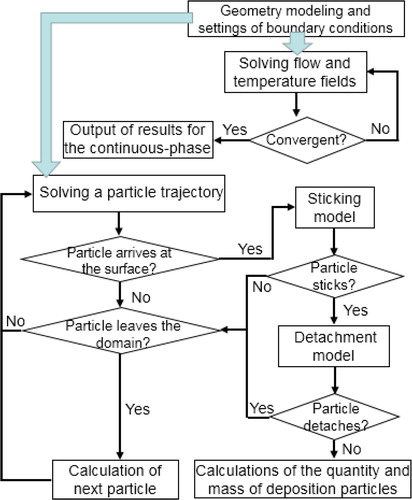
Figure 3. Grid independence study. (a) Mesh view, (b) Film-cooling effectiveness near the blade-leading edge.
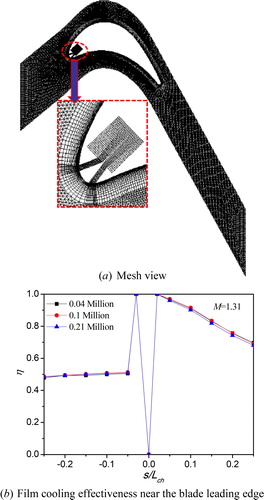
Figure 4. Model validation of the turbulence model using AGTB blade geometry.
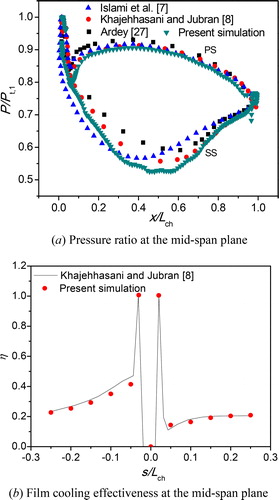
Figure 5. Model validation of deposition model.
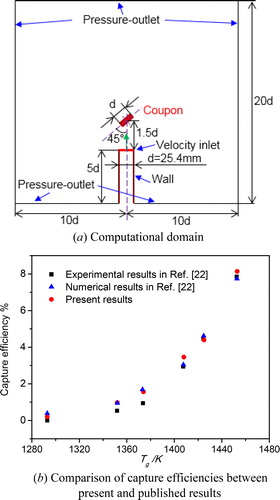
Figure 6. Comparison of film-cooling effectiveness distributions for the cases with various inlet flow angles at four blowing ratios.
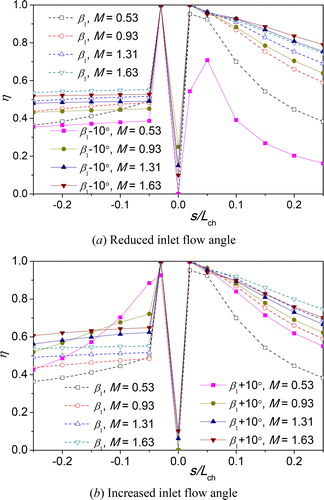
Figure 7. Streamlines and temperature contours near the leading edge for the cases with various inlet flow angles at four blowing ratios.
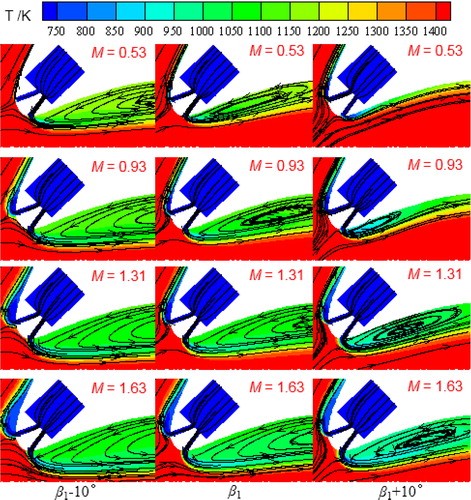
Figure 8. Particle trajectories for various particle diameters M= 0.93 and β1=133˚.
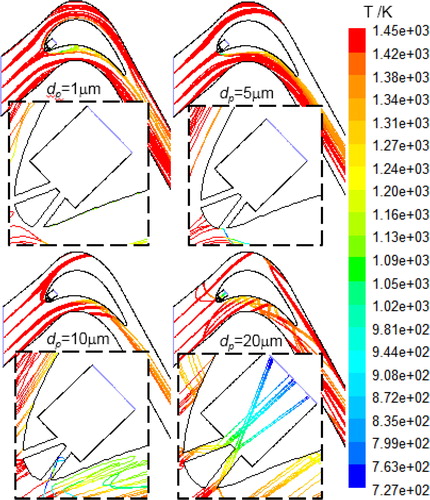
Figure 9. Comparisons of particle trajectories and temperature variations for various particle diameters M= 0.93 and β1=133˚.
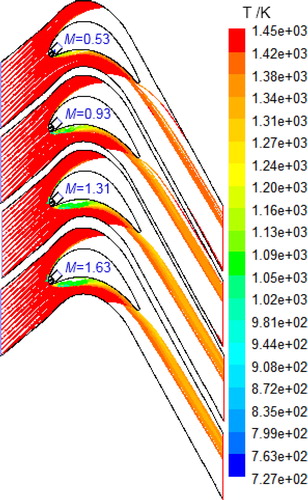
Figure 10. Comparisons of particle trajectories and temperature variations for various inlet flow angles at M=0.53 and 1.63, dp=0.93.
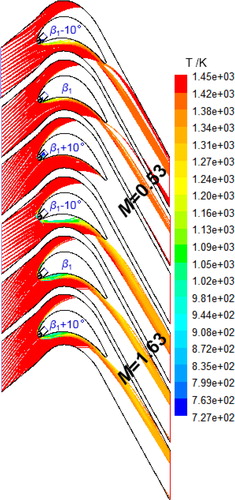
Figure 11. Comparisons of impact and capture efficiencies in different zones based on various particle sizes.
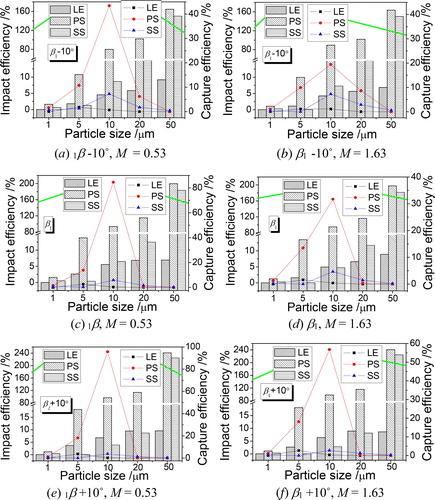
Figure 12. Comparisons of impact and capture efficiencies at different blowing ratios based on various inlet flow angles.
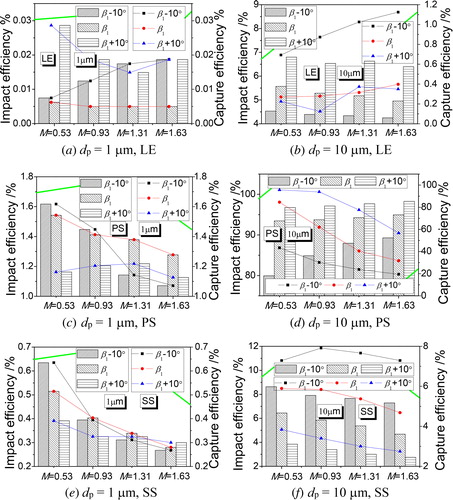
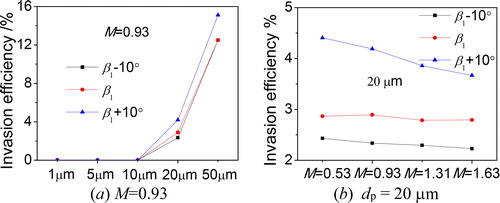
Figure 13. Comparisons of invasion efficiencies under various particle sizes, inlet flow angles, and blowing ratios. (a) M=0.93. (b) dp=20 μm.