12,894
Views
147
CrossRef citations to date
0
Altmetric
Review Article

Colorimetric Sensor Arrays for the Detection and Identification of Chemical Weapons and Explosives

, , , , &
Pages 138-153 | Published online: 01 Nov 2016

Figures & data

Figure 1. Structures of selected warfare agents.

Figure 1. Structures of selected warfare agents.

Figure 2. Structures of selected explosives. TNT (2,4,6-trinitrotoluene), DNT (2,4 dinitrotoluene), HMX (octahydro-1,3,5,7-tetranitro-1,3,5,7-tetrazocine), Tetryl (2,4,6-trinitrophenylmethylnitramine), DDNP (diazodinitrophenol), RDX (cyclotrimethylenetrinitramine), PA (picric acid), DMNB (2,3-dimethyl-2,3-dinitrobutane), TATP (triaceonetriperoxide).
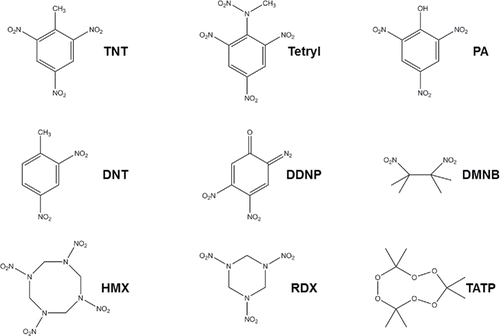
Figure 2. Structures of selected explosives. TNT (2,4,6-trinitrotoluene), DNT (2,4 dinitrotoluene), HMX (octahydro-1,3,5,7-tetranitro-1,3,5,7-tetrazocine), Tetryl (2,4,6-trinitrophenylmethylnitramine), DDNP (diazodinitrophenol), RDX (cyclotrimethylenetrinitramine), PA (picric acid), DMNB (2,3-dimethyl-2,3-dinitrobutane), TATP (triaceonetriperoxide).

Table 1. Summary of common chemical detection methods.

Table 2. Advantages and disadvantages of colorimetric sensor arrays.

Figure 3. An in-house created liquid-based sensor array showing changes in color (left) and fluorescence in the image (right) in the presence of various narcotic samples. The color changes compared to a water control sample can be used to identify the analytes.
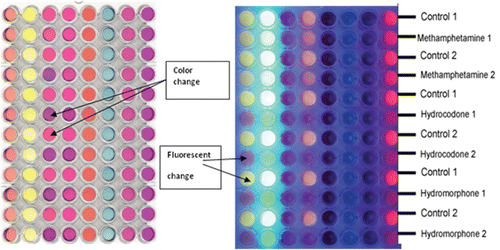
Figure 3. An in-house created liquid-based sensor array showing changes in color (left) and fluorescence in the image (right) in the presence of various narcotic samples. The color changes compared to a water control sample can be used to identify the analytes.

Figure 4. A colorimetric array printed with a commercially available inkjet printer showing four rows of four different sensors.
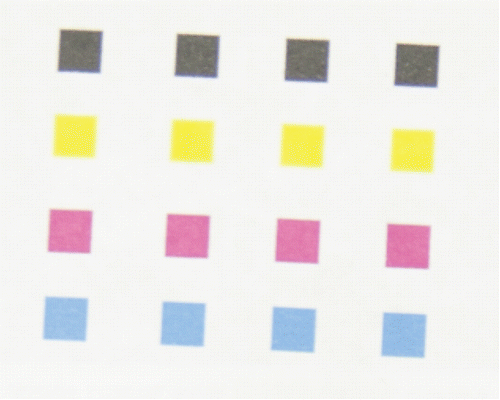
Figure 4. A colorimetric array printed with a commercially available inkjet printer showing four rows of four different sensors.

Figure 5. Euclidean distance for 0.5 – 10 M NaOH (blue) and HCl (red), and a water control (grey). For both analytes, the color is darker for higher concentrations.
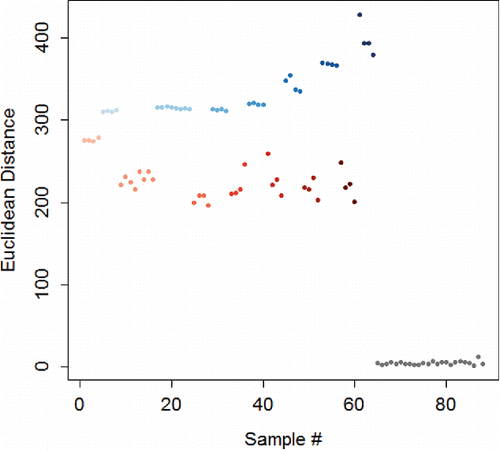
Figure 5. Euclidean distance for 0.5 – 10 M NaOH (blue) and HCl (red), and a water control (grey). For both analytes, the color is darker for higher concentrations.

Table 3. Identification of caffeine, cocaine, and nicotine using a unique binary code specific to each analyte. Data obtained from (Lyon et al., Citation2012a).

Figure 6. Biplot from principal component analysis (PCA). Water (grey), HCl (red), and NaOH (blue) each form distinct groups, and the NaOH concentrations form distinct groups. The cluster in the top left quadrant represents the HCl samples, while the cluster on the far right represents NaOH, and the cluster in the left lower quadrant represents the control samples (water). The ellipses represent 90% confidence intervals. PC1 and PC2 are the first and second components from PCA, respectively.
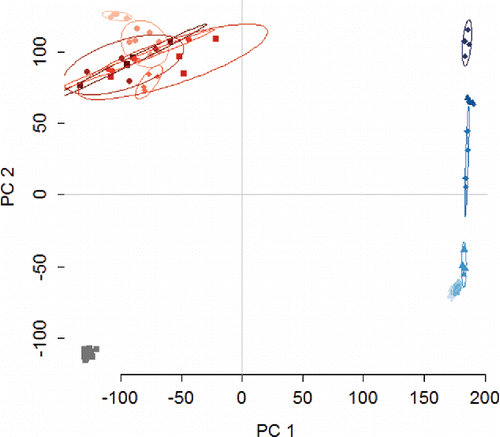
Figure 6. Biplot from principal component analysis (PCA). Water (grey), HCl (red), and NaOH (blue) each form distinct groups, and the NaOH concentrations form distinct groups. The cluster in the top left quadrant represents the HCl samples, while the cluster on the far right represents NaOH, and the cluster in the left lower quadrant represents the control samples (water). The ellipses represent 90% confidence intervals. PC1 and PC2 are the first and second components from PCA, respectively.

Figure 7. Three dimensional plot using PCA results based on the first three components. The 1.0 M (yellow) and 0.5 M (orange) samples are separated from the HCl samples at higher concentrations. The various concentrations are clearly separated, as the 10 M samples appear in the upper left quadrant, and the lower concentrations are aligned linearly downwards towards the bottom right. The lowest concentration (0.5 M) samples are the furthest (light blue) from the highest concentration (red) samples. The ellipses represent 90% confidence intervals.
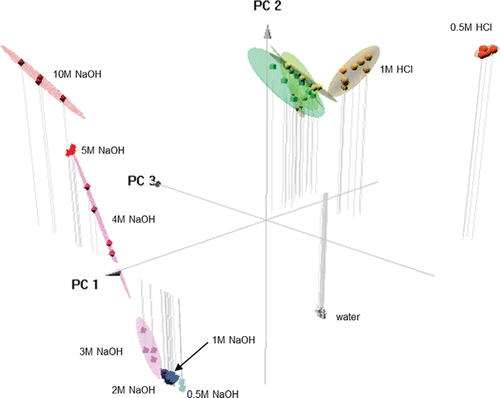
Figure 7. Three dimensional plot using PCA results based on the first three components. The 1.0 M (yellow) and 0.5 M (orange) samples are separated from the HCl samples at higher concentrations. The various concentrations are clearly separated, as the 10 M samples appear in the upper left quadrant, and the lower concentrations are aligned linearly downwards towards the bottom right. The lowest concentration (0.5 M) samples are the furthest (light blue) from the highest concentration (red) samples. The ellipses represent 90% confidence intervals.

Figure 8. Hierarchical cluster analysis (HCA) for 0.5 – 10 M concentrations of NaOH (blue), HCl (red), and water control (grey). For both analytes the color is darker for higher concentrations. Distinct clusters are formed for water, NaOH, and HCl. Some misclassifications for concentrations are present, particularly in the acid samples. The y-axis shows the Euclidean distance squared (based on RGB units).
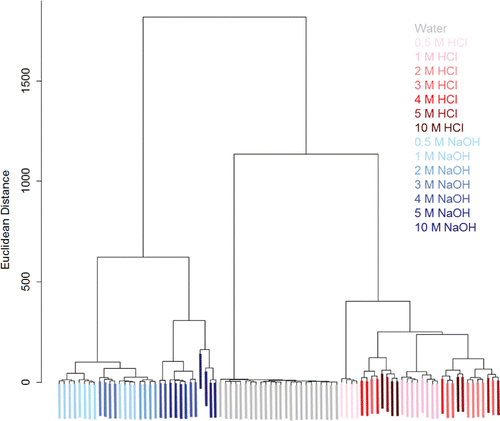
Figure 8. Hierarchical cluster analysis (HCA) for 0.5 – 10 M concentrations of NaOH (blue), HCl (red), and water control (grey). For both analytes the color is darker for higher concentrations. Distinct clusters are formed for water, NaOH, and HCl. Some misclassifications for concentrations are present, particularly in the acid samples. The y-axis shows the Euclidean distance squared (based on RGB units).

Figure 9. Linear discriminant analysis (LDA) for 0.5 – 10 M concentrations of NaOH (blue), HCl (red), and a water control (grey). For both analytes, the color is darker for higher concentrations. There is clear a separation between the water, HCl, and NaOH samples, and moderate separation between the concentrations of acid and base. LD1 and LD2 are the first and second directions from LDA, respectively (units are based on RGB values).
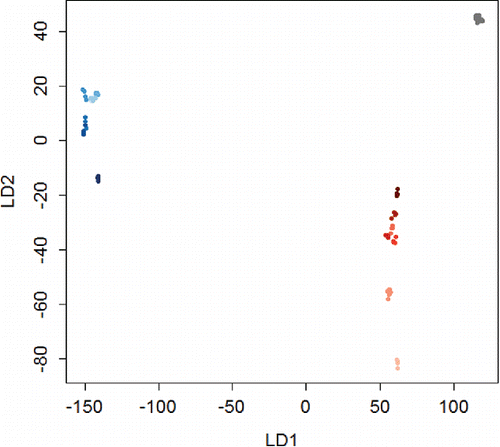
Figure 9. Linear discriminant analysis (LDA) for 0.5 – 10 M concentrations of NaOH (blue), HCl (red), and a water control (grey). For both analytes, the color is darker for higher concentrations. There is clear a separation between the water, HCl, and NaOH samples, and moderate separation between the concentrations of acid and base. LD1 and LD2 are the first and second directions from LDA, respectively (units are based on RGB values).

Figure 10. The Dismounted Reconnaissance Set that is currently used by the US Army. Figure obtained from Chemical, Biological, Radiological, & Nuclear Information Resource Center (CBRN IRC), 2014.
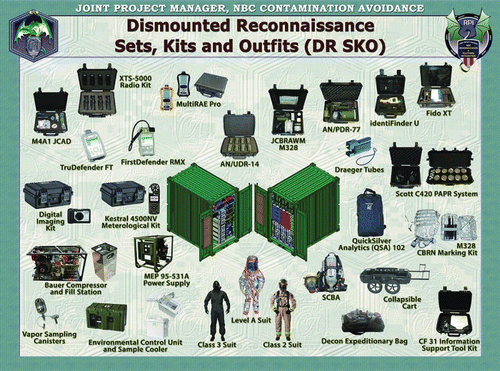
Figure 10. The Dismounted Reconnaissance Set that is currently used by the US Army. Figure obtained from Chemical, Biological, Radiological, & Nuclear Information Resource Center (CBRN IRC), 2014.

Figure 11. Prototype printed colorimetric array analysis kit. The kit contains the sensor array, disposable pipet, instructions, and silica gel desiccant sealed inside a protective foil packet.
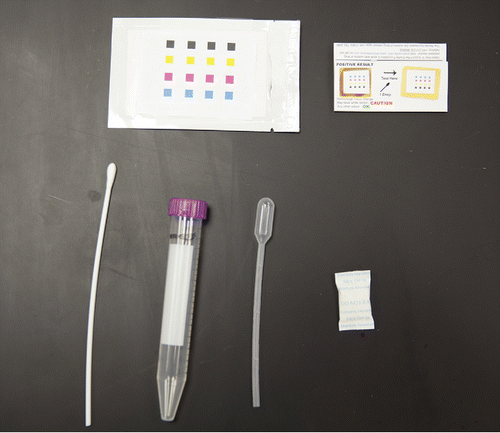
Figure 11. Prototype printed colorimetric array analysis kit. The kit contains the sensor array, disposable pipet, instructions, and silica gel desiccant sealed inside a protective foil packet.

Figure 12. Image collection with a smartphone. With a built in camera and processing power, a smart device could easily be used as the basis for an inexpensive, portable chemical identification system.
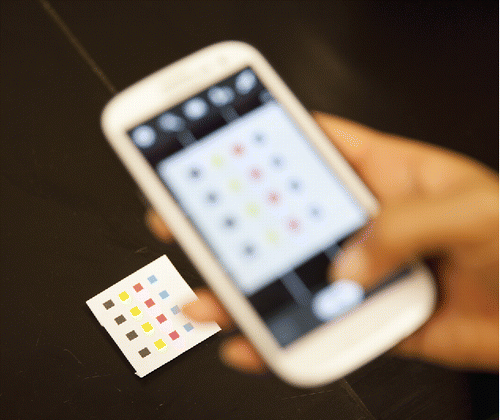
Figure 12. Image collection with a smartphone. With a built in camera and processing power, a smart device could easily be used as the basis for an inexpensive, portable chemical identification system.

Figure 13. An example of a smartphone app for data collection and analysis. A smartphone with an appropriately designed app can automate the image collection, image processing, and sample identification steps and serve as a simple user-friendly device.
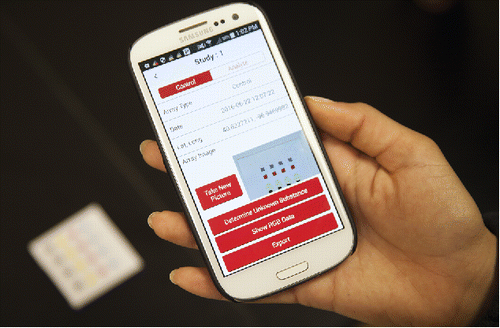
Figure 13. An example of a smartphone app for data collection and analysis. A smartphone with an appropriately designed app can automate the image collection, image processing, and sample identification steps and serve as a simple user-friendly device.

Figure 14. In-house created control chart for the red channel bromophenol blue. The points are measurements, and show that the sensor has not changed over many measurements. The solid lines are 3-standard deviation control limits, and the dashed lines are 2-standard deviation upper and lower warning lines.
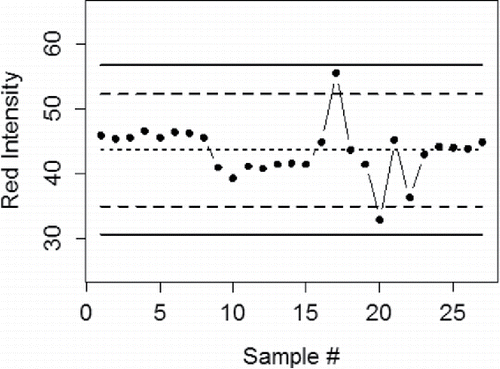
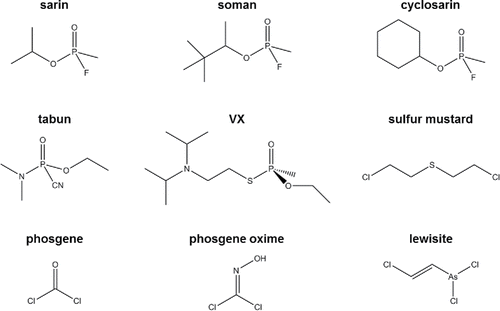
Figure 14. In-house created control chart for the red channel bromophenol blue. The points are measurements, and show that the sensor has not changed over many measurements. The solid lines are 3-standard deviation control limits, and the dashed lines are 2-standard deviation upper and lower warning lines.