Figures & data
Figure 1. Inter-connection between different “omics” approaches, environment and diet.
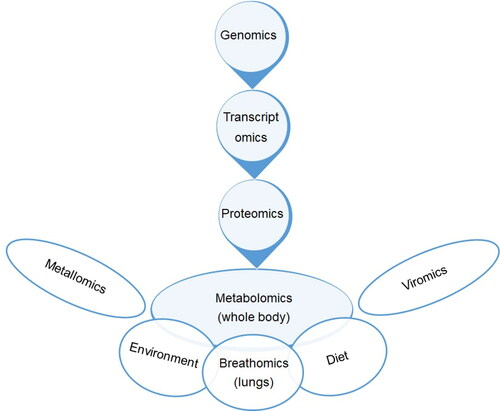
Table 1. Metabolomics studies on respiratory diseases using EB or EBC (breathomics) samples.
Figure 2. Box plots of exhaled concentrations of acetone, isoprene, pentanal and DMS (A) as well as limonene, ethanol and isopropanol (B). Black box plots: healthy controls; red box plots: T1DM patients; * and # indicate statistically significant differences with p < 0.001 and p = 0.002, respectively. ©Nature Publishing Group. Reproduced with permission Nature Publishing Group.[Citation26] Permission to reuse must be obtained from the rightsholder.
![Figure 2. Box plots of exhaled concentrations of acetone, isoprene, pentanal and DMS (A) as well as limonene, ethanol and isopropanol (B). Black box plots: healthy controls; red box plots: T1DM patients; * and # indicate statistically significant differences with p < 0.001 and p = 0.002, respectively. ©Nature Publishing Group. Reproduced with permission Nature Publishing Group.[Citation26] Permission to reuse must be obtained from the rightsholder.](/cms/asset/249a31cd-8aa1-439a-8707-38486626e12e/batc_a_1889961_f0002_c.jpg)
Figure 3. EBC levels of the biomarkers in healthy control (blue) and chronic kidney disease patients (red). ©Kluwer Academic. Reproduced by permission of Kluwer Academic.[Citation175] Permission to reuse must be obtained from the rightsholder.
![Figure 3. EBC levels of the biomarkers in healthy control (blue) and chronic kidney disease patients (red). ©Kluwer Academic. Reproduced by permission of Kluwer Academic.[Citation175] Permission to reuse must be obtained from the rightsholder.](/cms/asset/db1da8fe-5cc8-46dc-bdf2-7146d29c2335/batc_a_1889961_f0003_c.jpg)
Table 2. Metabolomics studies on non-respiratory diseases using EB or EBC (breathomics) samples.
Figure 4. Schematic representation of the device for EBC sample collection from cetaceans. ©American Chemical Society. Reproduced by permission of American Chemical Society (https://pubs.acs.org/doi/abs/10.1021/ac5024217).[Citation213] Permission to reuse must be obtained from the rightsholder.
![Figure 4. Schematic representation of the device for EBC sample collection from cetaceans. ©American Chemical Society. Reproduced by permission of American Chemical Society (https://pubs.acs.org/doi/abs/10.1021/ac5024217).[Citation213] Permission to reuse must be obtained from the rightsholder.](/cms/asset/15aeffdd-7a99-4986-969c-e32403ee24c9/batc_a_1889961_f0004_c.jpg)