Figures & data
Figure 1. An overview of the MAM workflow for analysis of biotherapeutic proteins from process development to product characterization. Sample preparation using enzymatic digestion can be accomplished by manual handling or automated workflows involving robotic platforms with different proteases. The peptide mapping experiment comprises the discovery phase to assess sequence coverage and identify the product quality attributes (PQAs). A list of CQAs is created in a peptide workbook format which is then used for routine GMP-compliant monitoring of the selected targets, detection of new features, and reporting.
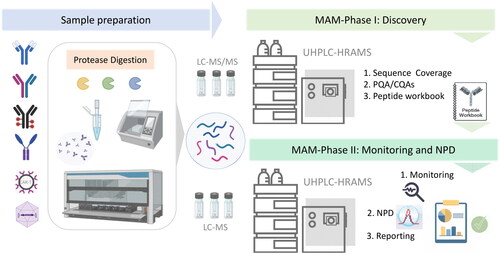
Figure 2. Schematic overview of advanced MAM method transfer, from research and development to manufacturing and QC using an eWorkflow procedure that contains all the associated methods and the reporting template required to set up the injection sequence, acquire, process the data, and summarize the results in a report with a visual pass/fail representation. Data lake allows for software integration, instrument management, data storage, seamless data and workflow transfer, accelerated data processing and advanced reporting.
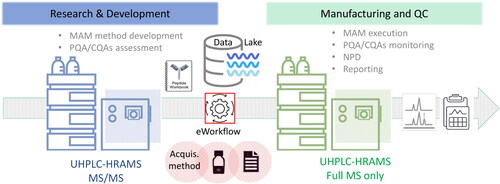
Table 1. Manual sample preparation protocols used for MAM approach.
Table 2. Automated sample preparation protocols used for MAM approach.
Figure 3. New Peak detection workflow for Chromeleon CDS and BioPharma Finder software for identification purposes. PR (pattern recognition) Element = 0, indicates only features with monoisotopic mass will be included. PR size > 1, indicates that at least one additional isotope must be detected. Ratio allows for a 1000-fold change (either more or less) in terms of average intensity.
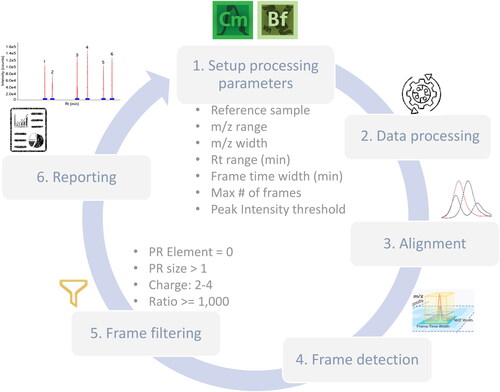
Figure 4. NPD for the detection of HCPs spiked into a commercial chimeric IgG1 drug product (DP): (a) new peaks (red trace) detected in the HCP 1000 ppm spiked sample compared to the commercial DP (blue trace) and (b) new peaks (red trace) detected in the HCP 100 ppm spiked sample compared to the commercial DP (blue trace). Corresponding defined frame detection and filtering parameters are summarized on the right-hand side for each frame plot.
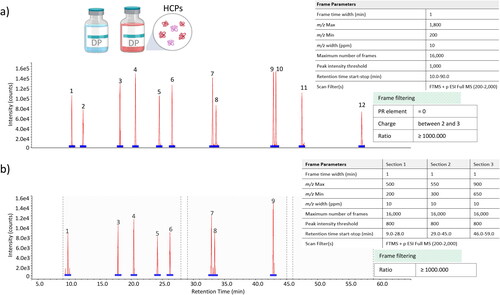
Table 3. Identified HCP peptides as new peaks in commercial DP spiked with 1000 ppm of HCPs by comparing to the reference sample (unspiked DP) using BioPharma Finder.
Table 4. NPD kit contents (for more details see reference 49).
Table 5. Critical NPD parameters and tolerance windows selected based on InterLab study.
Table 6. Sources of non-conformity and mitigation strategies for NPD experiments.
Figure 5. Example of iMAM workflow as an in-process test to monitor the behavior of biotherapeutic product quality attributes. Depending on the therapeutic modality of interest, sample preparation may require just dilution, a desalting step or cell removal. Multiple chromatographic separation techniques are available for native intact protein analysis: SEC (size exclusion chromatography), IEC (ion-exchange chromatography), RP (reversed-phase chromatography), ProA (protein A affinity chromatography), HIC (hydrophobic interaction chromatography), HILIC (hydrophilic interaction liquid chromatography) or μCE (microfluidic capillary electrophoresis by ZipChip™). Data processing involves a characterization step to define a list of proteoforms which will be used in the target intact workbook for the monitoring phase. NPD is used for new entities searching. A final report summarizes all monitored attributes and their relative abundances and a pass/fail condition to indicate they meet the established acceptance criteria.
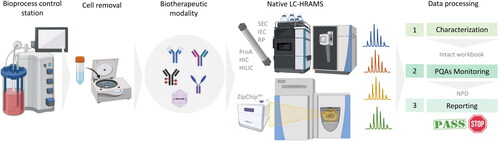
Figure 6. Summary of software and hardware requirements for MAM at the different stages.
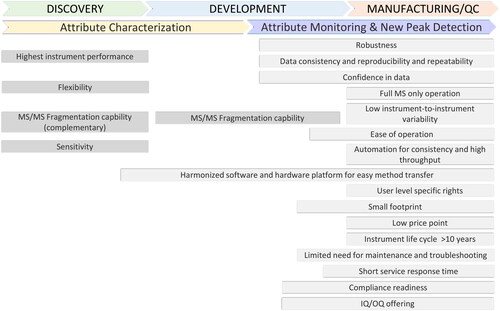
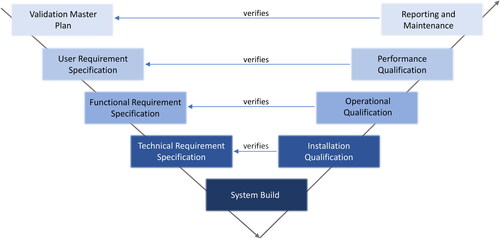
Figure 7. V-model diagram for CSV planning and execution.