Figures & data
Figure 1. Bile pigment metabolism – from heme to bilirubin (modified according to Wagner et al. [Citation33]). Hemoglobin is cleaved to yield globin and heme. Heme is enzymatically converted to biliverdin by liberating iron, via oxidation of its α-methene bridge, with loss of a carbon atom (CO). This opens the porphyrin ring, forms the open-chain, linear tetrapyrrole biliverdin, which yields bilirubin after enzymatic reduction of biliverdin’s central methine bond. In the liver, bilirubin is conjugated to enable excretion into the bile, requiring the enzymes UGT1A1 (conjugation) and MRP2 (excretion into the bile). HO: heme oxygenase; BLAVR: biliverdin reductase; UGT1A1: uridine glucuronosyl transferase 1A1; MRP2: multi-drug resistance protein-2.
![Figure 1. Bile pigment metabolism – from heme to bilirubin (modified according to Wagner et al. [Citation33]). Hemoglobin is cleaved to yield globin and heme. Heme is enzymatically converted to biliverdin by liberating iron, via oxidation of its α-methene bridge, with loss of a carbon atom (CO). This opens the porphyrin ring, forms the open-chain, linear tetrapyrrole biliverdin, which yields bilirubin after enzymatic reduction of biliverdin’s central methine bond. In the liver, bilirubin is conjugated to enable excretion into the bile, requiring the enzymes UGT1A1 (conjugation) and MRP2 (excretion into the bile). HO: heme oxygenase; BLAVR: biliverdin reductase; UGT1A1: uridine glucuronosyl transferase 1A1; MRP2: multi-drug resistance protein-2.](/cms/asset/270d23ff-c590-4a4e-877d-1a6e98564f74/ilab_a_1428526_f0001_c.jpg)
Figure 2. Geographical prevalence of benign hyperbilirubinemia (GS) in articles reporting TB concentrations (i.e. data are not derived from genetic analysis) in the general population [Citation19–27].
![Figure 2. Geographical prevalence of benign hyperbilirubinemia (GS) in articles reporting TB concentrations (i.e. data are not derived from genetic analysis) in the general population [Citation19–27].](/cms/asset/e5b2859d-61da-44a3-97db-fae8aaf84f45/ilab_a_1428526_f0002_b.jpg)
Table 1. Diagnostic and clinical features of hyperbilirubinemia syndromes (modified according to Strassburg [Citation67]).
Figure 3. Summary of the different hyperbilirubinemia syndromes (GS, Crigler-Najjar syndromes type 1 and 2 OR CN-1 and CN-2) based on different UGT1A1 activities.
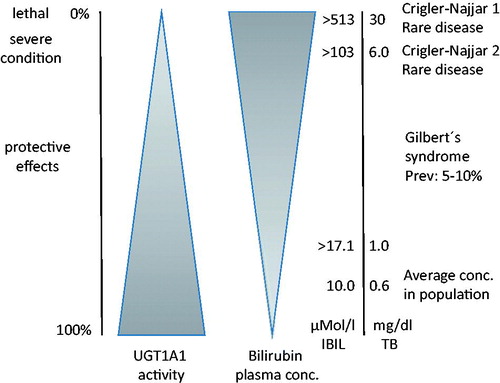
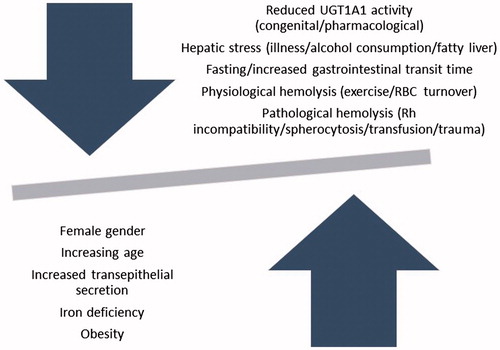
Figure 4. Factors affecting circulating unconjugated bilirubin concentrations.